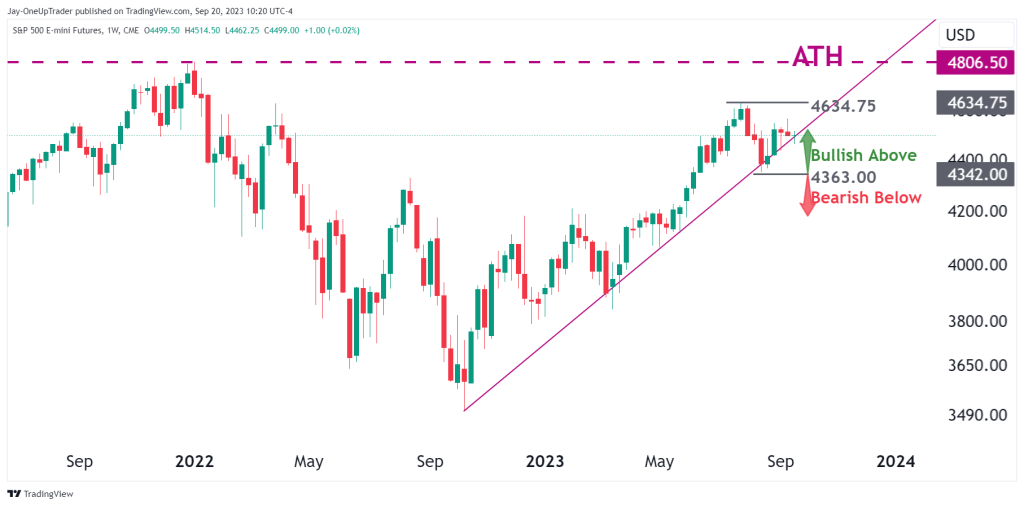
- The weekly chart signals that price action is bullish as it bounces off a support trend line.
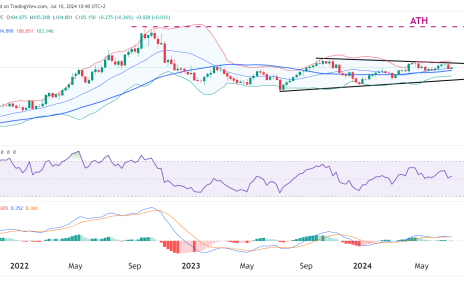
- Potential formation of an ascending trianlge on the daily chart.
- Price is only 7% away from all-time highs.
Weekly Chart
Zooming out and looking at price action from the start of the year shows us a small resemblance to a cup formation, which leads me to believe that if we see a handle in the next few weeks or months, there is potential for a much bigger bullish move in ES, one that could lead us to a 30% rally. ES is only 7% away from all-time highs at the moment.
A strong bullish trend line started exactly one year ago, and price continues to follow. At current price levels, ES is testing this level and appears to be bouncing for now.
Daily Chart
Zooming in on the daily chart, there is a morning star pattern that formed a few weeks ago, and even since then, price action has been to the upside. This formation occurred on the trend line mentioned on the weekly chart. This is a significant level because as long as price remains above it ($4363), the chart remains bullish, and thus, all short signals can be ignored. If you know the trend is up, then why take shorts?
At the moment, there appears to be an ascending trianlge forming, which could lead to a bullish break above all-time highs. The chart has a bullish bias overall, and taking shorts could be a risky game to play.