

Introduction
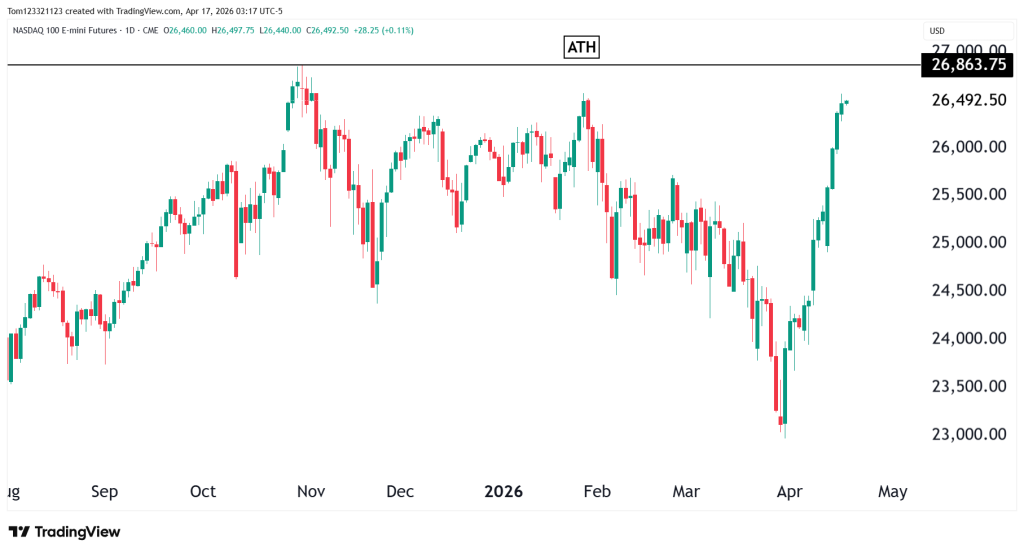
NQ has staged a very aggressive V-shaped reversal, rallying from the ~23,000 lows back toward 26,500+, approaching the all-time high (~26,863). This is a big difference from a few weeks ago when NQ was sitting at a one-year low.
Just recently, the market was breaking down, showing weakness and uncertainty. Now, it’s back within reach of highs in a matter of days.
Lets take a look at the technicals and what they are telling us.
Key Levels
Resistance:
- 26,500–26,863 (ATH zone)
This is the level that matters most. Markets rarely break all-time highs cleanly on the first attempt after a V-reversal. Also, the market may be fragile once it reaches the highs after a strong rally like this. That is becuase there are no clean higher highs and higher lows, so eventually there would need to be profit taking. The profit taking most likely leads to a consolidation period. In this case, it could lead to a flag pattern or pennant where price breaks above the highs and buying power gets even stronger.
Support:
- 25,500–25,700 (recent breakout / acceleration zone)
- 24,800–25,000 (prior consolidation area)
If price pulls back, these are the areas where buyers need to show up.
Scenarios and Probabilities
| Scenario | Description | Estimated Probability |
|---|---|---|
| Pullback | Rejection at ATH → retrace toward 25,500–25,000 | 40% |
| Breakout | Clean break and hold above ATH → continuation higher | 35% |
| Consolidation | Range between ~25,500–26,800 before next move | 25% |
Possible Trades
- Longs: Better on pullbacks into 25,500–25,700, not at highs
- Breakouts: Only valid if price can hold above ATH, not just tag it
- Shorts: Become interesting on clear rejection at ATH, especially with momentum
Chasing strength into all-time highs after a V-reversal tends to carry poor risk/reward.
Final Takeaway
NQ has shifted from looking weak to showing real strength in a short space of time.
Because the move happened so quickly, the market hasn’t really had time to build a solid foundation underneath it.
At these levels, the market tends to show its true intent. If price can move above the highs and stay there, it suggests the strength is real and the trend can continue. But if it struggles and gets pushed back, that doesn’t mean the move has failed. It often just means the market needs time to breathe, to pull back, and to build a stronger base before trying again.
