After gold made an all-time high a few weeks ago, the yellow metal sold off, and the chart turned bearish very quickly. The bulls will be happy to see that the selling pressure has softened and a new rally has begun. GC is now getting very close to the previous all-time high, where we saw that huge bearish reversal candle on the daily chart. Let’s see what the technicals are telling us.
Weekly Chart Analysis:
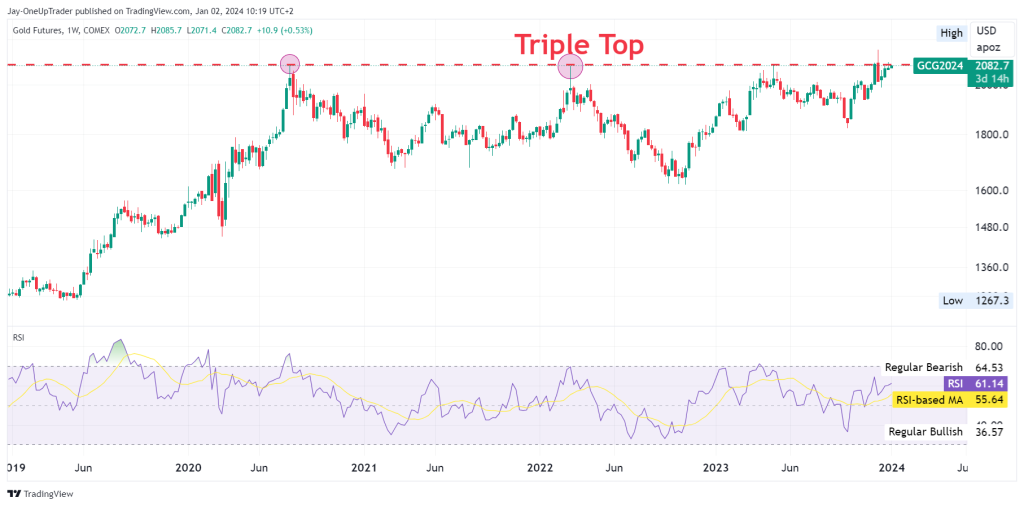
The Relative Strength Index (RSI) is hovering around 61.14, which is below the overbought threshold of 70. This leaves room for potential upside before the market might consider the asset overbought. As traders, we should watch for any bearish reversals or breakouts above this level, which could invalidate the Triple Top pattern.
Daily Chart Analysis:
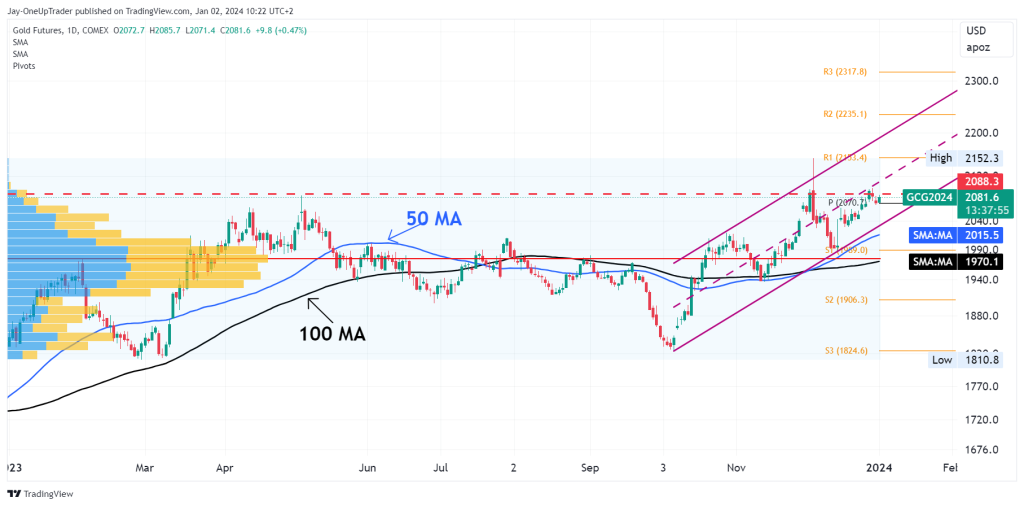
The daily time frame shows us that Gold Futures are trading within a rising channel, showing consistent higher highs and higher lows, a bullish sign. The price is above the 50-day Moving Average (MA) and 100-day MA, both of which should act as a support level. With the price currently at 2081.6, we are close to the channel’s upper boundary and the pivot point (P) at 2070.7.
Trade Ideas:
Considering the weekly Triple Top pattern and the daily channel, here are some trade ideas:
- Short Trade: If the price fails to break above the current resistance level and shows signs of reversal, such as a bearish candlestick pattern, we could initiate a short position. The target for this trade would be the 50-day MA on the daily chart, around 2015.5, with a stop loss just above the reversal candlestick pattern.
- Long Trade: If we see a strong bullish breakout above the Triple Top resistance and all-time high, this could indicate a continuation of the uptrend. In this scenario, we could enter a long position, targeting the next resistance levels, which could be around the R1 pivot point at 2135.4 on the daily chart. A stop loss could be placed below the breakout level or the bullish breakout candle.
Levels to Watch:
- Resistance Level & ATH (Triple Top): 2080.7 – 2152.3
- Support Level (50-day MA/trend channel): 2015.5
- Pivot Point: 2070.7