Introduction
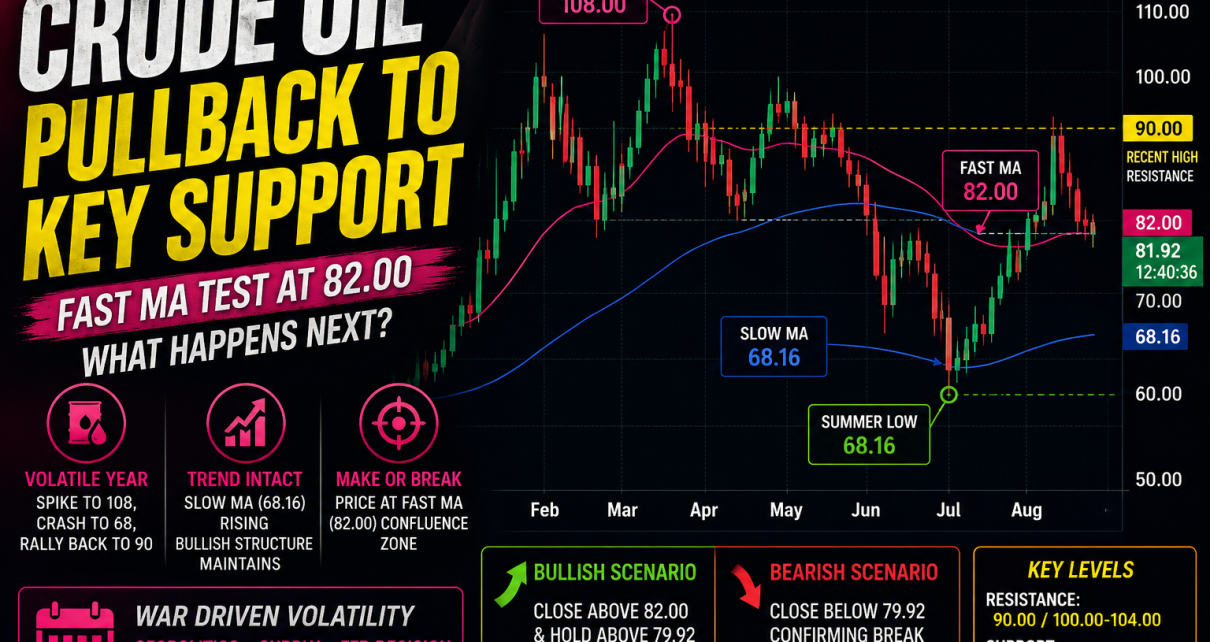
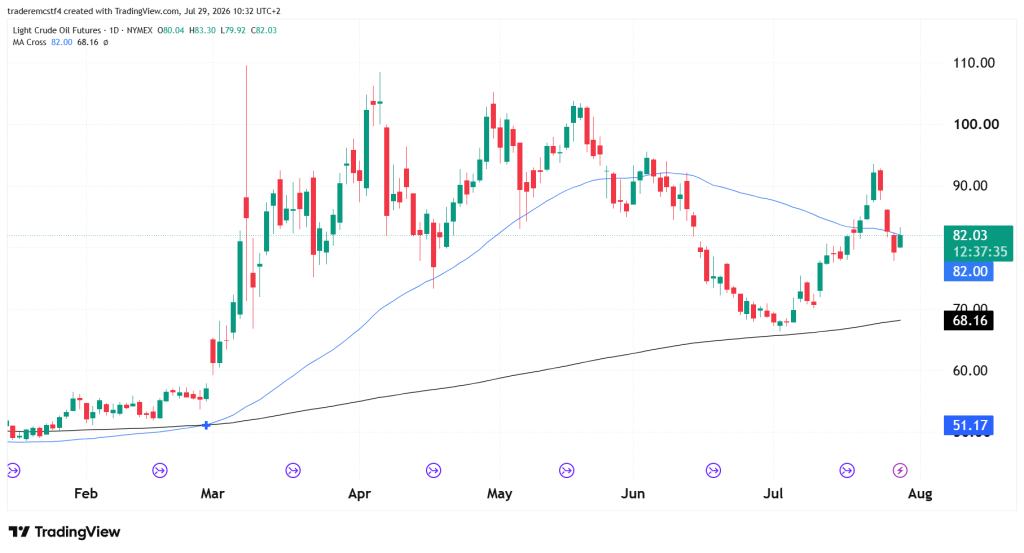
Crude oil has had one of its more volatile years on record in 2026, and the daily chart tells that story clearly. A geopolitical shock sent prices spiking sharply in the spring, only for a ceasefire to trigger an equally sharp collapse. After bottoming in the high-60s, price staged a fast recovery. Price got close to hitting the psychological $100 level a few days ago, and the market is now digesting the 40% rally that started at the beginning of July. The past 3 days have been red so now is an important time for bulls to establish a new surge of buying or the $70 level comes back into focus.
Key Support and Resistance Levels
Major Resistance
| Level | Notes |
|---|---|
| 90.00 | Recent swing high from the mid-July rally; first hurdle on any renewed push higher |
| 100.00 – 104.00 | Confluence of the April/May distribution highs; a major overhead supply zone |
| 108.00 | Spring panic-spike high; unlikely to be tested soon barring a fresh geopolitical shock |
Major Support
| Level | Notes |
|---|---|
| 82.00 | Faster moving average, coinciding with the horizontal pivot level price is testing today |
| 79.92 | Today’s session low |
| 75.00 – 77.00 | Prior consolidation shelf from June, ahead of the summer breakdown |
| 68.16 | Slower moving average and the summer’s swing low — the key line in the sand for the broader uptrend |
Possible Trades
Bullish scenario — support holds and the recovery resumes
- Entry trigger: daily close back above 82.00 with the low holding above 79.92
- Stop: below 79.92
- Target: 90.00 initial, 100.00 extended if momentum carries through the prior resistance shelf
Bearish scenario — moving average confluence fails
- Entry trigger: daily close below 79.92, confirming a failed retest of the 82 confluence zone
- Stop: back above 82.00
- Target: 75.00 initial, 68.16 (slow MA / summer low) as an extended downside objective
Invalidation / range scenario
- If price continues to chop between roughly 80 and 90 without a decisive break, treat this as consolidation after the V-recovery rather than a new directional signal
- A move below 68.16 would be the first real technical evidence that the broader uptrend structure in place since January has actually reversed
Market Context
The Iran conflict is driving this chart’s volatility, full stop. When Trump announced the two-week ceasefire in April — including a commitment to reopen the Strait of Hormuz — oil prices crashed 20%, with WTI hitting roughly 91. That’s the reversal you see after the spring spike.
Crude kept sliding into June as Gulf tanker traffic resumed and traders priced in oversupply. Then the ceasefire broke on July 7–8, and prices snapped back — that’s your V-shaped bounce on the CL chart.
This week, Brent dropped to about $84, its lowest in over a week, as Iran and Saudi Arabia’s foreign ministers opened talks on managing the Strait. Meanwhile, API data showed US crude inventories down 3.3 million barrels — supply is still tight.
Bottom line: this market moves on headlines, not fundamentals. The 82 level is being tested right as Strait diplomacy heats up. One news cycle decides which way this breaks.
Summary
Crude Oil is pulling back into a well-defined confluence zone at 82 after a volatile round trip that saw price spike above 100, crash into the high-60s, and then recover sharply. The broader trend, reflected in the still-rising slow moving average, remains constructive, but the market needs to hold this 80-82 zone to keep that structure intact. A clean break either side of the 79.92–82.00 range should set the tone for the next multi-week move, with ongoing Strait of Hormuz diplomacy the key fundamental wildcard to watch alongside this week’s Fed decision.
Trading futures involves substantial risk of loss and is not suitable for all investors. Past performance is not indicative of future results. This analysis is for informational and educational purposes only and does not constitute financial advice. Nothing in this article should be construed as a recommendation to buy or sell any security or financial instrument. Always conduct your own due diligence and consult with a licensed financial advisor before making any trading decisions.