Introduction
Nasdaq 100 futures continue to hold up well after their strong spring rally, even as the index takes a breather below its recent all-time highs. NQ ran from roughly 24,000 in April to a high near 31,000 by early June, and price has spent the last month digesting that move rather than reversing it.
Let’s take a closer look at the NQ chart and see if there’s a tradeable setup forming.
Join Our Discord & Receive a 20% Discount! → Join Now
Nasdaq 100 Futures Trend Analysis
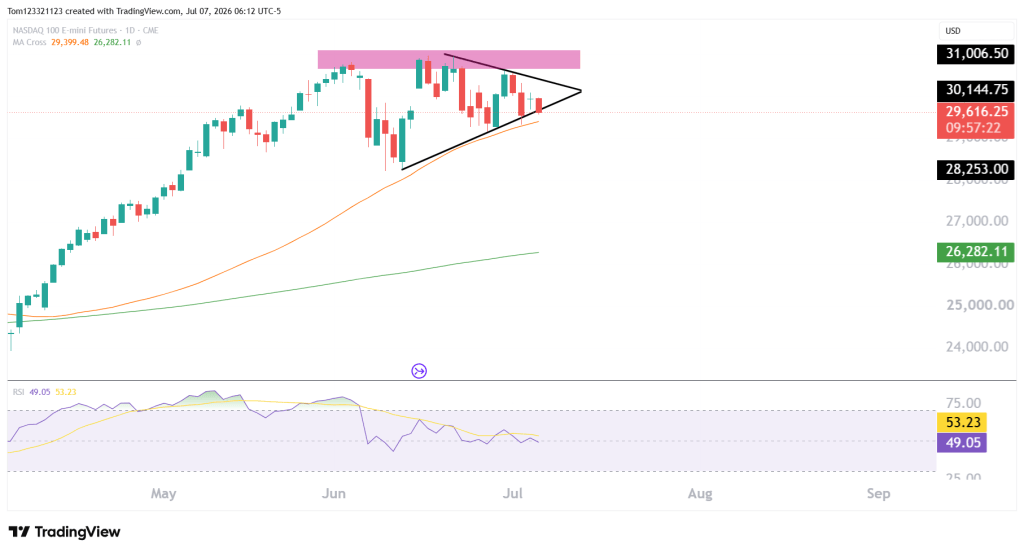
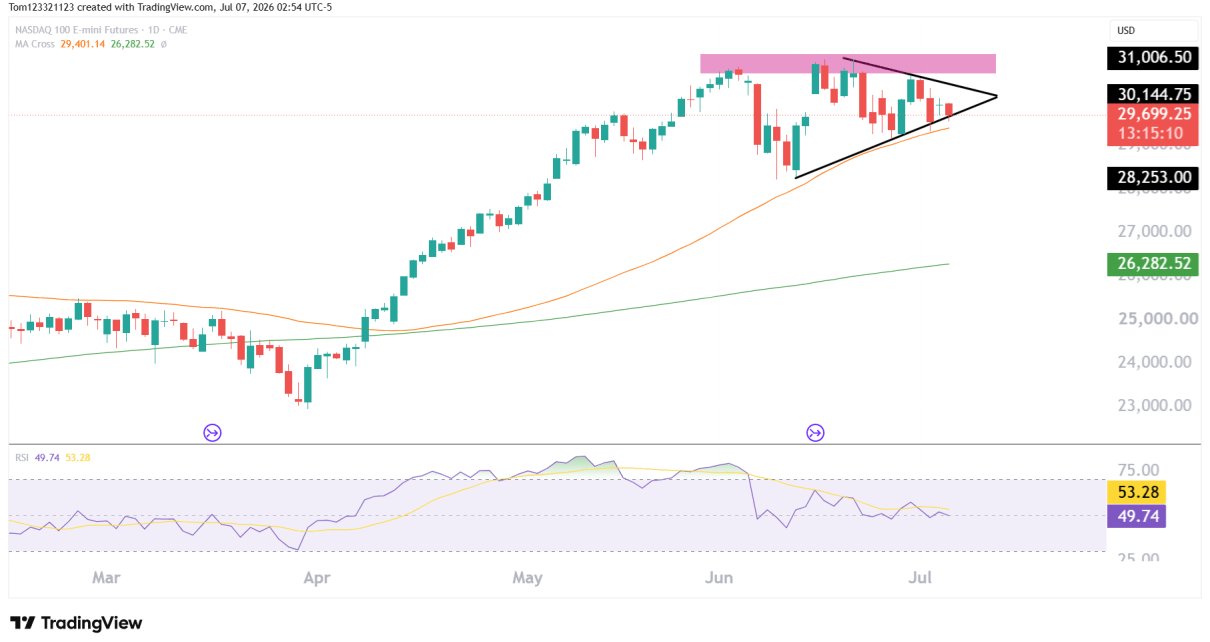
The broader uptrend on NQ remains intact. Price is trading at 29,645, above the rising 50-day moving average (29,400) and well clear of the 200-day moving average (26,282) — both signs that the underlying trend structure is healthy, not exhausted.
RSI is sitting at 49.29, essentially neutral. It ran hot in the 60–75 zone during April and May’s strongest push, then cooled sharply during the June pullback and has been hovering near the midline since. That’s consistent with what we’re seeing on price: momentum has calmed down, but there’s no strong directional signal yet — the market is coiling rather than committing.
Since early June, price has carved out a symmetric triangle: a series of lower highs capped by a descending trendline, and a series of higher lows supported by a rising trendline. The apex of that triangle is tightening and due to resolve over the next couple of weeks, which typically means a bigger move is close.
Key Support and Resistance Levels
Major Resistance
| Level | Notes |
|---|---|
| 30,100 – 31,000 | Prior high / rejection zone, upper boundary of the current triangle |
| 31,006 | Session high, immediate overhead level |
Major Support
| Level | Notes |
|---|---|
| 29,400 | Rising 50-day MA, confluence with the triangle’s lower trendline |
| 28,253 | Prior swing low area, first real support below the triangle |
| 26,282 | 200-day moving average |
Nasdaq 100 Futures Possible Trades
Breakout Trade Setup With the triangle’s apex approaching, the highest-probability play is waiting for a decisive break rather than guessing the direction early.
- Bullish scenario: A daily close above 31,000 would confirm the uptrend resuming, using the prior high area as a springboard toward new highs.
- Bearish scenario: A break below the rising trendline and the 50-day MA (29,400) would open the door to a deeper pullback, with 28,253 as the first support test.
- Trigger: Wait for a clean daily close outside the triangle rather than reacting to an intraday wick — triangles are prone to false breaks near the apex.
- Invalidation: A quick reversal back inside the triangle after a breakout attempt would suggest a fakeout, not a genuine trend resumption.
Pullback Trade Setup (if bullish breakout confirms) For traders who miss the initial breakout, a retest of the 30,100 zone (old resistance, potential new support) or the 50-day MA would offer a second entry opportunity in the direction of the break.
Summary
NQ remains structurally bullish above its 50- and 200-day moving averages, but it’s currently coiled inside a tightening symmetric triangle with momentum sitting neutral. The next decisive daily close outside 29,400–31,000 is likely to set the tone for the coming weeks — a break above 31,000 favors continuation of the broader uptrend, while a break below the 50-day MA opens up a deeper pullback toward 28,253.
This analysis is provided for educational and informational purposes only and should not be considered financial or trading advice. Trading futures, forex, and other leveraged financial instruments carries a high level of risk and may not be suitable for all investors. Past performance is not indicative of future results. Before making any trading decisions, conduct your own research, assess your risk tolerance, and consult with a qualified financial advisor if necessary.