Introduction
NQ closed at red to start the week off, below its 50-day moving average (29,801.12) for the first time since this leg of the rally began. Price also dipped as low as 29,303.25 intraday, testing the rising trendline off the recent triangle before bouncing back. Combined with a bearish MACD reading, this is the first real crack in what’s otherwise still an intact uptrend.
The market is still very much consolidating, so there is no need to go on in terms of medium-term signals. With that said, there are some trades we can take on the shorter term, so let’s take a closer look at the technicals and take it from there.
Nasdaq 100 Futures Trend Analysis
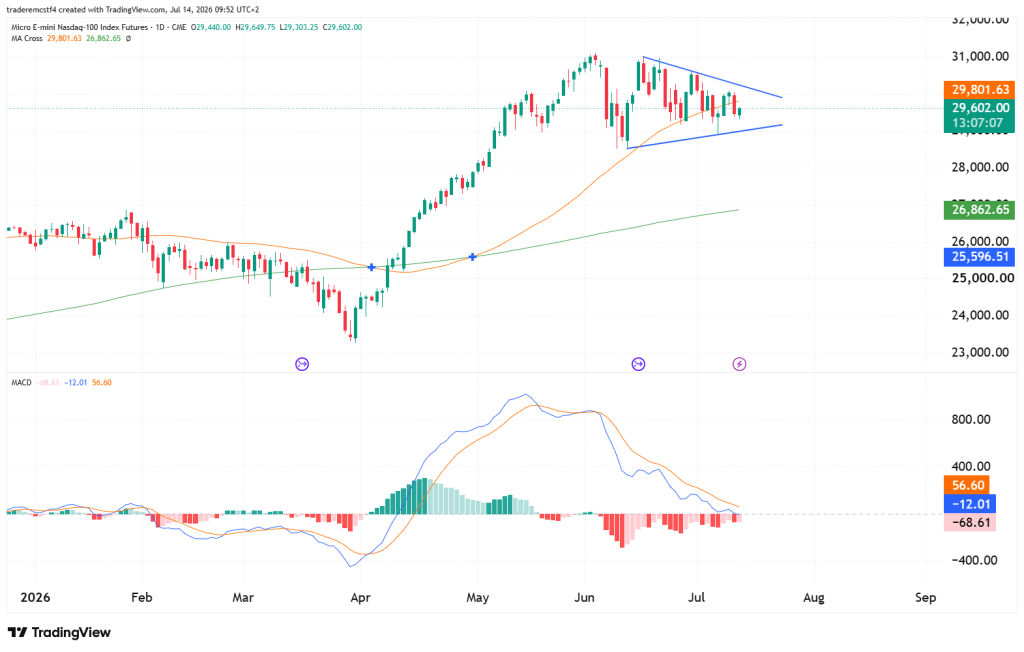
We are still watching the triangle formation because of the strong uptrend that occured before it started forming. This means that if we see a bullish break, it is a very good chance that we see price accelerate to new highs again from there and could be the continuation of the uptrend. The important thing is to be patient and wait to see if the price reacts like this instead of trying to front-run it.
Key Levels
| Level | Notes |
|---|---|
| 31,000 | Prior high from June, still the level that needs to be reclaimed for the broader uptrend to resume decisively |
| 29,801 | 50-day MA, now acting as resistance after today’s close below it |
| 29,300 | Rising trendline / today’s low, immediate support being tested |
| 28,900 | Prior swing low, next support if the trendline gives way |
| 26,862 | 200-day MA |
Possible Trades
Scenario 1: Trendline holds, range continues Given the trendline held test even with the close below the 50-day MA, a bounce back toward the upper part of the triangle is a reasonable near-term outcome.
- Entry: Bullish reaction at or near 29,300
- Stop: Below 28,900
- Target: 29,801 first, then the upper triangle boundary near 30,200
Scenario 2: Trendline breaks, deeper pullback (higher probability given current momentum) With MACD negative and price already below the 50-day MA, a break of the rising trendline and a close below 29,300 would confirm the short-term trend has turned, not just paused.
- Trigger: Daily close below 29,300
- Target: 28,900, with further downside risk toward the 200-day MA (26,862) if that level also fails
- Invalidation: A quick reclaim of 29,300 would suggest this was a shakeout rather than a genuine breakdown
Scenario 3: Reclaim of 31,000 Lowest-probability near-term outcome given the current MACD and moving average readings, but a decisive close back above 31,000 would put the bullish continuation case back in control.
This analysis is provided for educational and informational purposes only and should not be considered financial or trading advice. Trading futures, forex, and other leveraged financial instruments carries a high level of risk and may not be suitable for all investors. Past performance is not indicative of future results. Before making any trading decisions, conduct your own research, assess your risk tolerance, and consult with a qualified financial advisor if necessary.