- 6J surges 4.3% in July amid a weakening Dollar and forms a symmetrical triangle pattern on the daily chart, indicating potential volatility ahead.
- Key technical indicators to consider for trading decisions in 6J: volume profile, 100 MA, and Wyckoff volume.
- Exercise caution around the upcoming FOMC meeting, favoring short-term time horizons and placing stop losses below 0.0072 for risk management.
Introduction
As the Dollar’s slump continues, we have seen the majority of currencies rally. 6J is no exception and has rallied 4.3% in July. This has formed a symmetrical triangle pattern on the daily chart, which we can monitor for the next few weeks and months. There are also other technical patterns we can look at to guide our trading decisions in the Yen which we will look at. They include; volume profile, 100 moving average, and Wyckoff volume.
Technical analysis
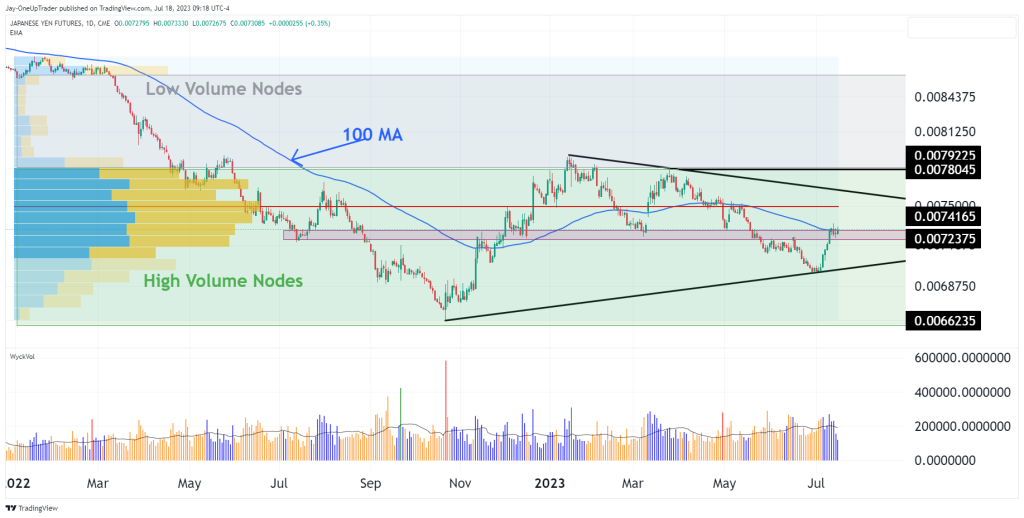
Triangle: A triangle has formed on the daily chart, now giving 6J a range to trade within. A break in either direction would likely lead to volatile price action. A break to the upside, however, would be a better trade opportunity due to the low-volume nodes above the triangle.
Volume Profile: On the chart below, I have indicated the low-volume nodes with a grey box. It is above 0.0078. The volume is very low compared to the price range within the triangle. The low liquidity above the triangle will likely give bigger-ranging days as the price will be more volatile. The fact that the Dollar is weakening gives the bulls additional strength, too, and the risk-reward trade favors the bulls for this reason as well as the low-volume nodes above the triangle formation.
100 MA: The 100 moving average is currently being tested on the daily chart. This is generally always going to be a place where there is some pause in price action or the trend. The current price of 6J is also within a small resistance zone I marked off on the chart. We could see the price remain within this range for a few more days, or it may continue to rally within the next few hours/days. A break above 0.00736 means bulls can place stop losses below the low of this minor zone and the 100-moving average.
Volume: The volume began to increase slowly each day as the rally started off the support line of the triangle. This is a bullish sign as buying power slowing increased over time instead of all at once.
Trade Ideas
Taking trades in 6J favors the bulls at the moment. I see the probabilities there, as well as the risk-reward ratio play. Caution must be taken, though, because this hinges highly on the fact that the Dollar will continue to fall. If the FED changes its monetary policy suddenly, we could see extreme volatility in all currencies. With the FOMC meeting coming next week, it would be ideal to have a time horizon that is shorter than that because anything can happen at that meeting. With that being said, stops can be placed below the current lows of 0.0072.