


Introduction
Bitcoin has finally started to stabilize after dropping 53% since November. The selloff into the $58,000–64,000 support zone found buyers, and price has since pushed back up toward the mid-$70,000s. Momentum has improved, but that is not only in BTC, but also across assets, as even the S&P 500 has just made new highs. Something unbelievable since the war in the Middle East started.
Lets take a closer look at BTC technicals.
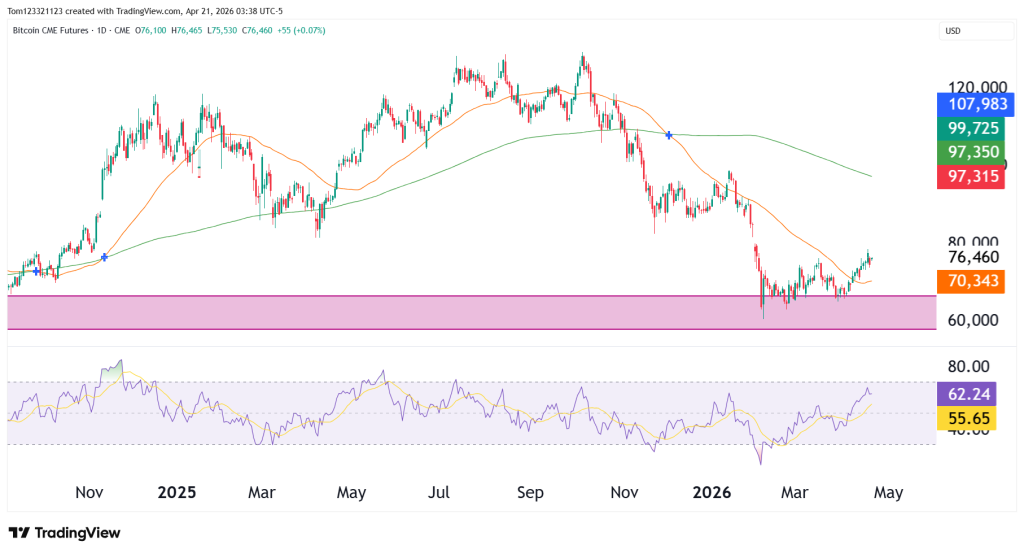
Price is now trading back above the 50-day moving average, around $70,300, which is constructive, but it remains well below the 200-day moving average, near the upper-$90,000s, and still far under the major resistance cluster overhead. Right now, Bitcoin looks more like it is recovering from damage than like it is proving a new bull leg has begun.
The chart is no longer weak in the same way it was at the lows, but it is not yet strong enough to remove doubt. We need to see BTC clear the resistance cluster at $90,000 and, even better, move above the 200-day moving average.
The recent bounce has a better tone than many dead-cat bounces do. Price reclaimed the 50-day moving average, and RSI has recovered into the low 60s, which usually means momentum is improving rather than collapsing. The chart also shows that the rebound came after a clear defense of the support zone.
At the same time, the move has not yet broken the broader pattern of lower highs. Until Bitcoin can push through resistance and hold there, this still has the feel of a market climbing back into supply rather than one that has already cleared it.
What the broader market is saying
The recent recovery in Bitcoin has been helped by renewed institutional interest. Reuters reported that Bitcoin had fallen nearly 15% this year from a peak above $126,000 to around the mid-$70,000s, while major firms such as Goldman Sachs and Morgan Stanley were still moving deeper into bitcoin ETF products. (Reuters)
There are also signs that ETF demand has picked up again. CoinDesk reported strong spot bitcoin ETF inflows in April, including one day with $663 million of inflows and another report showing $471 million on April 6, which supports the idea that the rebound is not purely retail-driven. (CoinDesk)
At the same time, the macro picture is still mixed. Reuters noted improving risk sentiment as war fears eased somewhat, and that broader shift has supported risk assets generally. But Reuters also reported that stalled U.S. crypto legislation led Citigroup to cut its 12-month Bitcoin target, showing that the longer-term policy backdrop remains less supportive than bulls had hoped a month ago. (Reuters)
Important Levels
Support
- $70,000–71,000: first near-term support, roughly around the 50-day moving average
- $58,000–64,000: major support zone and recent base
Resistance
- $78,000–80,000: first meaningful resistance from the recent structure
- $97,000–100,000: major trend resistance around the 200-day moving average
Is it time to buy Bitcoin?
For a trader: not the cleanest “all-in” buy spot yet. The bounce is good, but price is still below major resistance and the broader trend has not fully flipped. Chasing here assumes the recovery continues without much pullback.
For a long-term investor: this is a more reasonable area for gradual accumulation than it was near the highs, especially if your plan is measured and time-based rather than emotional. Strong ETF inflows and continued institutional product launches support the case that there is still deeper demand underneath Bitcoin over time. (Reuters)
Scenarios and Probabilities
| Scenario | Description | Estimated Probability |
|---|---|---|
| Recovery continues | BTC pushes through $78k–80k and extends higher | 35% |
| Range / consolidation | BTC chops between roughly $70k and $80k before deciding | 45% |
| Pullback | BTC loses $70k and rotates back toward the $64k area | 20% |
The highest-probability outcome right now looks like more consolidation.
Possible Trades
A bullish pullback entry makes the most sense if Bitcoin holds the $70,000–71,000 area and shows buyers defending it again. That would let you participate without chasing a rebound that is already extended off the lows.
A breakout long only starts looking cleaner if price can reclaim $78,000–80,000 and stay above it. That would be the first sign the market is doing more than just bouncing.
A defensive short or hedge becomes more interesting only if Bitcoin loses $70,000 and starts slipping back toward the support zone. Until then, the immediate downside pressure has eased.
This analysis is for educational and informational purposes only and does not constitute trading advice. Futures and forex trading involve significant risk and may not be suitable for all investors. Always conduct your own research before making trading decisions.