


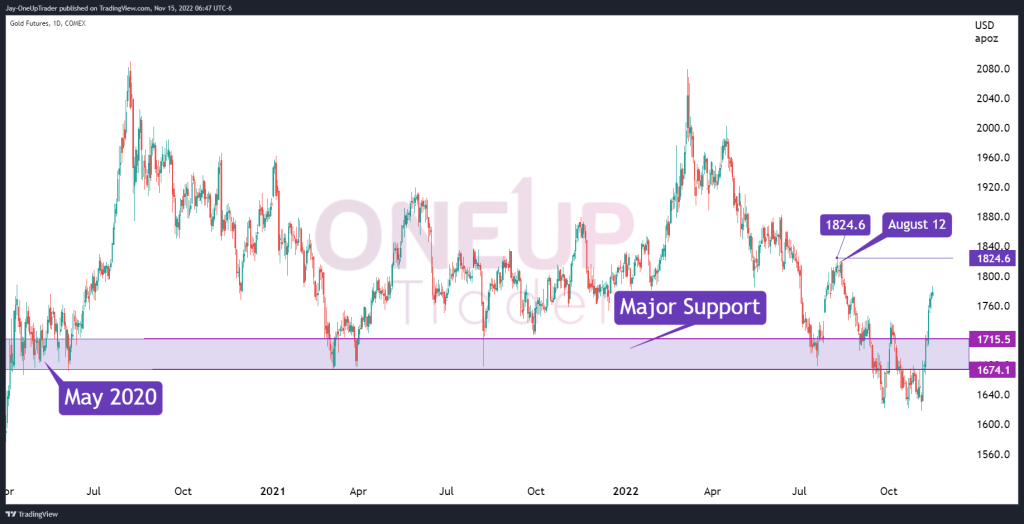
- Gold prices trading the major support zone on the monthly chart
- Potential bullish targets.
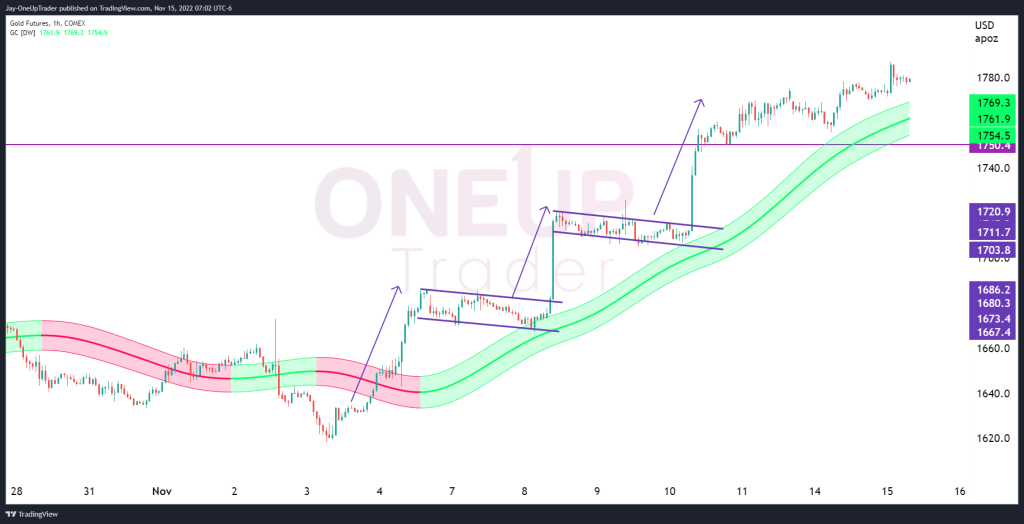
- RSI showing overbought in the short run.
- Bull flags and the Gaussian channel on the hourly chart.
Monthly View
We did a piece a few months ago on the multi-year support zone in Gold between $1,674.1 and $1715.5 here. The Gold price recently dipped below this level, but the bearish move has failed to hold, and we have seen an aggressive price rally in the yellow metal. Keep in mind that this is due to the better-than-expected CPI report from last week, which caused the Dollar to fall 7.8% from its peak in September.
RSI Showing Overbought
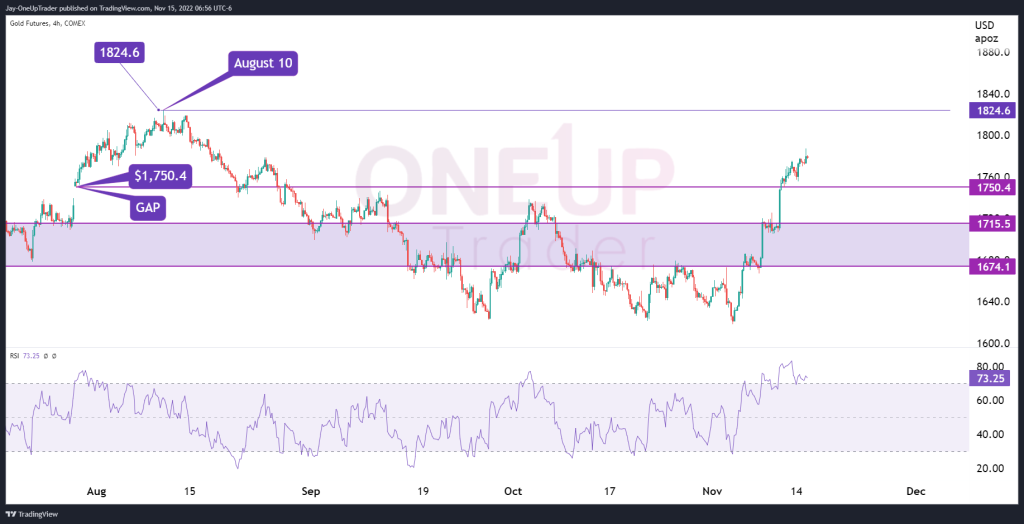
On the 4-hourly chart, we take note of the gap at $1,750.4. Even though this gap was already filled some time ago, it may hold as support if we see a retracement from current levels.
Regarding bullish targets, the high made on August 10th is the first significant level to watch. If Gold rallies to those levels, the price would be $1,824.6 per ounce.
The RSI is showing overbought at this point, currently printing 73.25. The fact that the RSI has been overbought for so long shows that the bulls are firmly in control. Moving forward, we may only see very small retracements as the Dollar continues to slide. Traders might want to consider waiting for minor pullbacks if they want to go long instead of chasing the market higher while the RSI is in an overbought status.
Hourly Chart Analysis
Applying the Gaussian channel indicator onto the hourly chart could be the way to enter positions for bulls. We must remember that there have been two bull flags and continuous higher highs with minor retracements, with the market often moving sideways. The question is whether the bullish momentum will continue or if the price needs to cool off for a bit.