- This week’s technical analysis highlights the prominent symmetrical triangle pattern on the chart, indicating a potential breakout.
- Stop loss levels for both bearish and bullish trades.
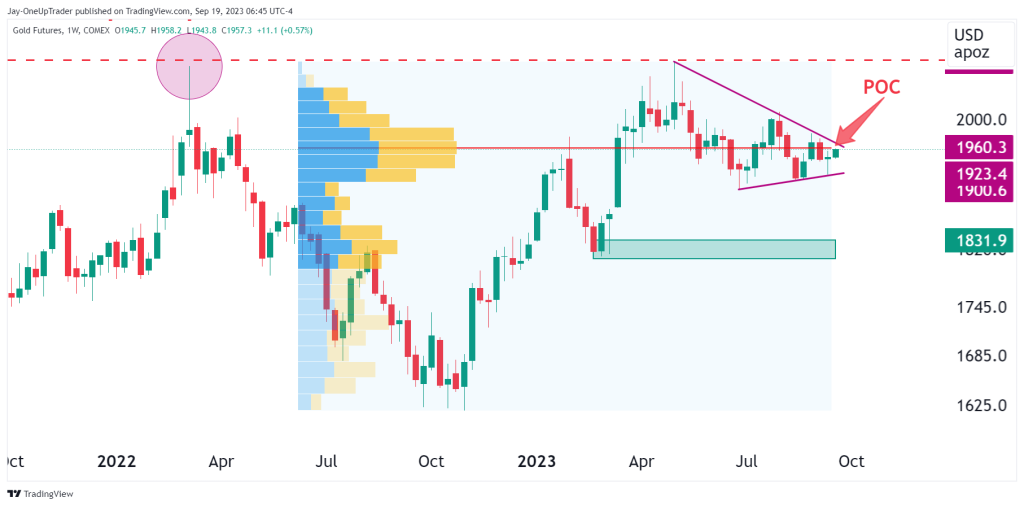
- Monitoring the Point of Control (POC) line at 1961.3 is crucial, as breaking and maintaining a price above this level could accelerate an uptrend, contingent on a symmetrical triangle breakout.
Recap
The last time we looked at Gold, we already identified a symmetrical triangle formation on the daily chart that could be the catalyst for a move in either direction. Yesterday, GC bounced off the low of that triangle and could be allowing the bulls to go long. Before we move on to this week’s analysis for GC, read the full article here.
Technical Analysis
The most clear and obvious aspect of the chart we are focusing on this week is the symmetrical triangle. Bulls who wish to go long could set stop losses below $1912.6 as price recently bounced off the low of the triangle, forming a type of spinning top. The spinning top pattern tells us that the market is confused is which direction to go, and thus, there is a deadlock between bulls and bears. This is more of a bullish sign when we bounce out of support or off a triangle low.
There is one thing that bulls should keep mindful of, and that is the point of control line for the volume profile indicator, which is right at where the current price action is for GC. The POC line is at 1961.3, and GC is currently trading at 1960.3. Once we see price clear this level and remain above it, we could see GC move a lot quicker in an uptrend because there are low-volume nodes above the POC line. This is only a possibility if the symmetrical triangle is broken to the top side, however, so please keep that in mind.