

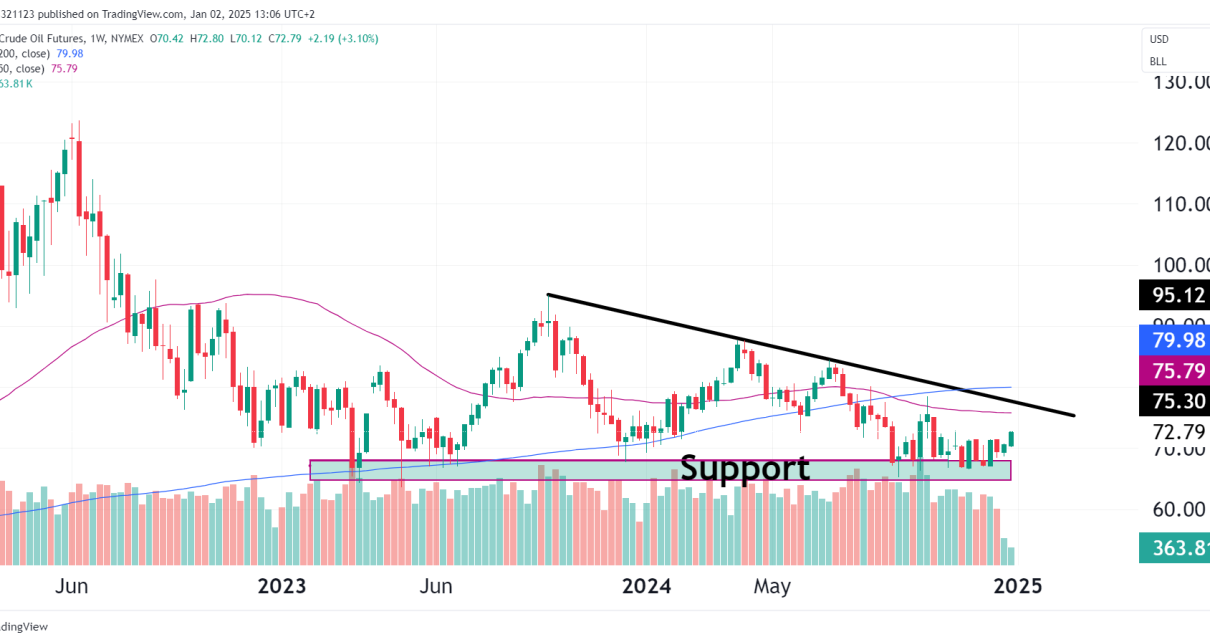
Crude oil futures are starting 2025 on a bullish note, with prices climbing +3.10% this week to trade at $72.79. As geopolitical stability improves and demand outlooks remain strong, oil prices are gearing up for a potential breakout above resistance levels, but let’s see what the technicals tell us.
Technical analysis
Strong Support
- Prices have rebounded convincingly from the $70-$72 support zone, a level that has been tested multiple times throughout 2023 and acted as a floor.
- The consistent defense of this area has created a strong base for bullish momentum to build.
Descending Trendline Resistance in Focus
- The downtrend line from the 2022 highs could be tested soon. A break above this resistance, currently near $75.30, could confirm a trend reversal and open the door to higher price targets.
- The volume profile shows increasing interest, suggesting potential breakout momentum too.
50-Week and 200-Week SMAs Supporting the Structure
- The 50-week SMA at $75.79 and the 200-week SMA at $79.98 are key levels for bulls to reclaim.
- A close above these levels would solidify the medium-term bullish outlook, but prices would need to hold above them and not simply reverse from the levels.
Bullish Case: Breakout Confirmation Above $75.30
- Support Base: The strong rebound from the long-term support zone and the steady defense of the $70 level reinforce bullish sentiment.
- Technical Breakout: A breakout above the $75.30 resistance would likely target the 200-week SMA at $79.98, with potential for further upside toward $95.12.
- Fundamental Tailwinds: Renewed optimism in global economic recovery and lower-than-expected U.S. crude stockpiles provide a fundamental backdrop for the rally.
Bearish Case: Resistance Rejection
- Trendline Rejection: If the price fails to break above the $75.30 level, it could lead to another pullback toward the $70 support zone.
- Dynamic Moving Average Resistance: The 50-week SMA remains a barrier for now, and continued failure to close above it would challenge the bullish thesis.
Trade Ideas
- Long Setup – Breakout Play
- Entry: Buy on a confirmed breakout above $75.30.
- Target 1: $79.98 (200-week SMA).
- Target 2: $95.12 (key resistance).
- Stop Loss: Below $73.00.
- Short Setup – Rejection Trade
- Entry: Sell if prices fail to close above $75.30 and show bearish reversal patterns.
- Target 1: $72.00 (support zone).
- Target 2: $70.00 (critical support).
- Stop Loss: Above $76.00.
Outlook & Summary
- Short-term (1-2 weeks): Prices are likely to test the $75.30 resistance, with a breakout leading to further bullish momentum.
- Medium-term (1-3 months): A confirmed breakout would target the $80-$95 range, while rejection at resistance could lead to consolidation around the $70-$75 zone.
- Long-term (3+ months): The bullish structure remains intact as long as the $70 support zone holds. A breakout above the 200-week SMA could signal the start of a new bullish cycle.