- Head and shoulders (H&S) target hit
- RSI indicates selling pressure is weakening
- Cautiously bearish on NQ
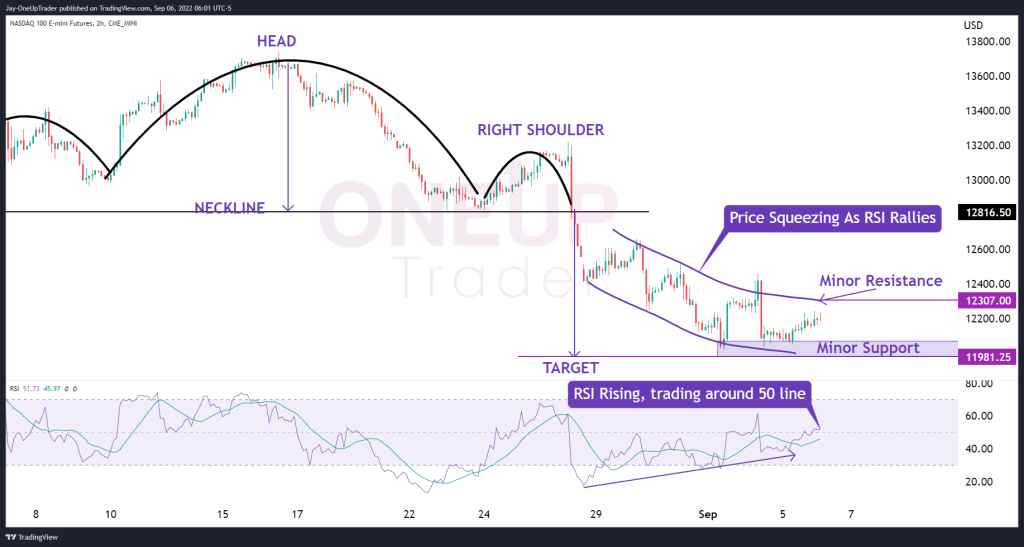
Refer to our analysis on August 30 for a detailed explanation of the Head and Shoulders (H&S) pattern formed on NQ which has been met. Normally, these patterns may get very close to the full target before consolidating or reversing. It also may continue far beyond our target, especially if the pattern forms in a longer-term downtrend, as it did in this case.
The Relative Strength Index (RSI)
Looking at the 2-hour chart, and with an RSI on default settings, we notice the selling pressure is dwindling as the lows on the indicator are getting higher and higher. As we’ve stated many times in these articles, this does NOT mean a reversal is imminent. Often it indicates that a consolidation period is likely to occur. We must always think objectively, in probabilities, and know that any time we are convinced of only one thing happening, we are doing it wrong.
The price is also showing signs of a squeeze occurring as the volatility lessens; this further indicates a consolidation period on the horizon.
What Next?
There is minor support just above $11,981.25, where traders could go long, but that could be a very risky trade with minimal upside because, at the moment, there is no sign that the downtrend has bottomed.
The ideal way to trade NQ now is to wait for small retracements into the minor resistance level at $12,307.00. This is because there is still the potential for the market to drop below the target level of our Head and shoulders. The potential risk-reward ratio is far greater than the long side of the trade.
There is always the possibility that the market finds support at the current price levels and could move higher back to $12,816.50. However, the probability seems low, so we remain cautiously bearish in our technical outlook.
Things to note
From here on, we are watching the price action at the support level just above $11,981.25, we are looking for any opportunities to short at $12,307 with targets back to the minor support or below. However, prices must remain below the minor resistance ($12,307). Any significant close above that level will mean this particular short trade will not be viable.