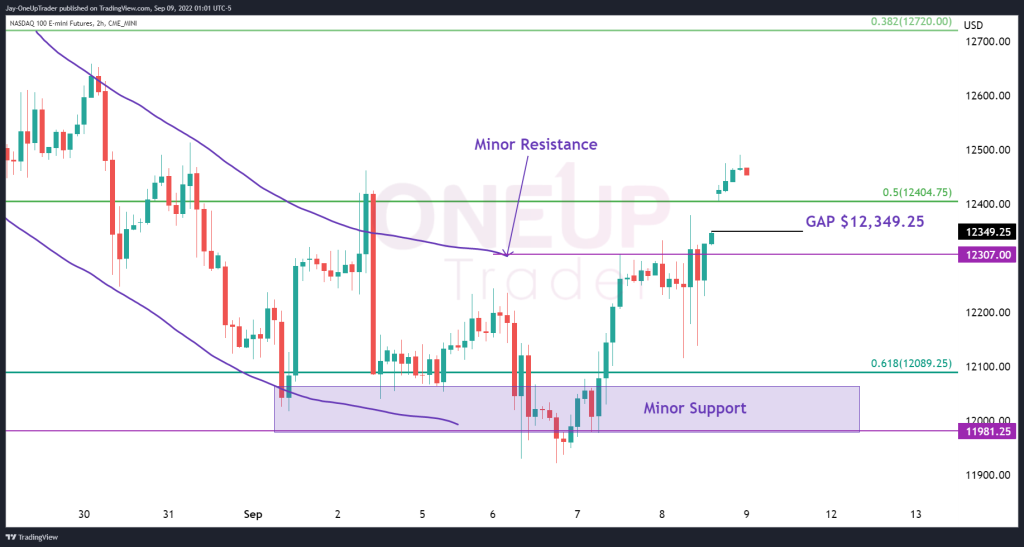
- A bullish breakout has occurred above the minor consolidation zone
- Bearish and Bullish Targets Clearly Defined
- A Gap opens at $12,349.25
Bullish Breakout
The minor consolidation referenced in our previous technical outlook has been broken to the upside and is trading above the Fibonacci 50% level. For Bulls, the next target to watch is the Fib level at $12,720.00; for Bears, the most immediate target is the gap at $12,349.50.
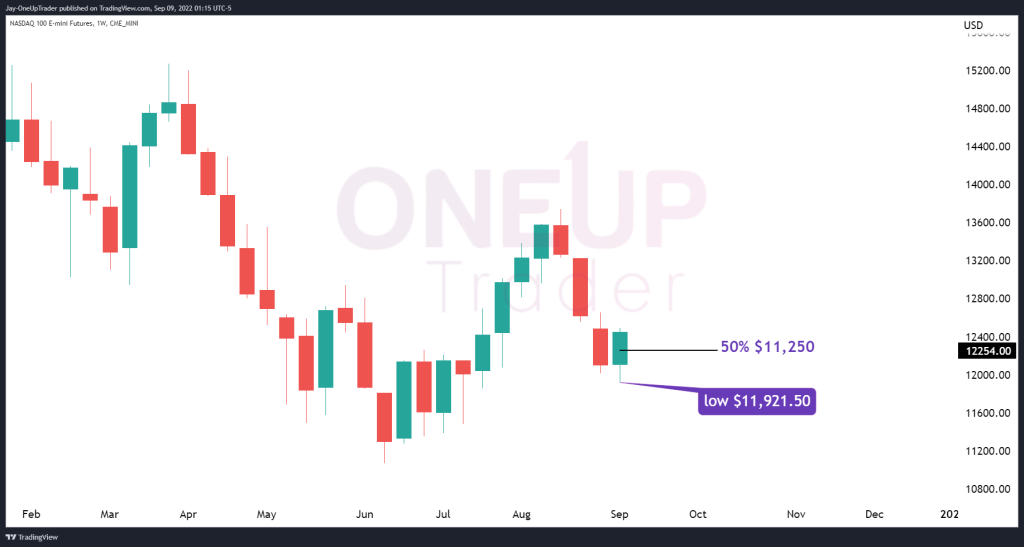
Weekly Chart
An interesting candlestick is forming on the weekly and could signal a temporary low has been put in at $11,921.50. This bullish weekly candle still needs to close above its open price at the end of the trading today. If it forms a very small or no wick on the top, it could signal a green start to Monday’s session.
We have seen three weeks in a row of red candles in the Nasdaq; this may indicate that the bullish candle we are seeing now could just be a temporary pullback as the market attempts to make lower lows in the next few weeks.
If prices remain above the $11,921.50 level, we can consider a potential reversal up to $12,720.00 (our Fib level described above) as a strong possibility. If prices fall back to around $11,250, which is 50% of this week’s move, long trades could be initiated with wide stops below $11,921.50.
As with everything in trading, this type of trade is by no means a certainty, and since the weekly candle hasn’t closed just yet, we can only prepare for what could happen and then have a plan of action as price action unfolds.
Summary
For the time being, there are decent opportunities for both the bears and the bulls. If traders remain objective in their approach and do not allow themselves to get convinced that one move (either higher or lower) is going to occur, then this can be a great environment to be trading in.