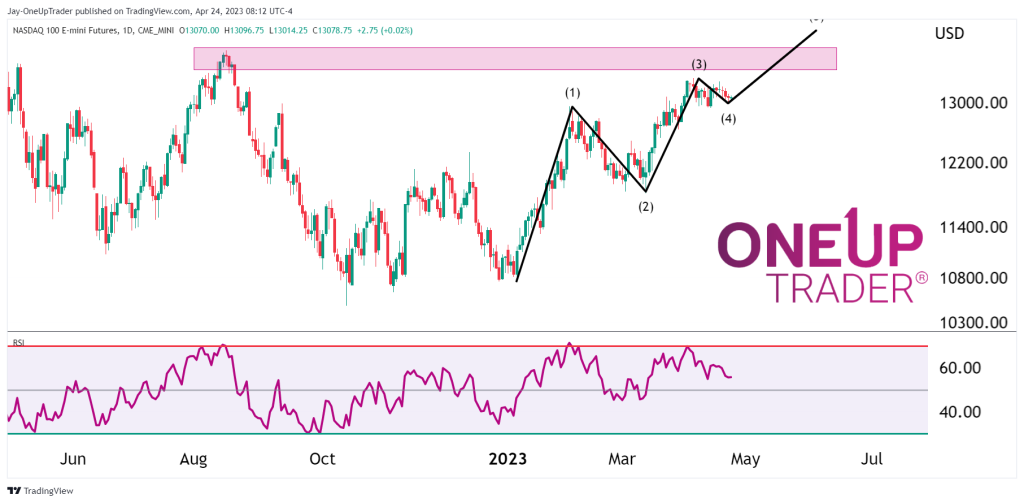
- Elliott wave theory analysis tells us that there is upside potential.
- Monthly chart outlook.
Technical analysis
NQ has begun a small consolidation move for the past few days. It appears the pullback may be in or the market could also be forming a flag at the moment.
There are trade opportunities, but we need to be mindful that if we do go long in this market that the pullback may continue a while longer. Stop losses would need to be set wide enough so that we do not get choked out of the trade even while being correct on the initial direction. Stops would be set below $12,350 and ideally even below the first elliot wave impulse move at $11,850.
The next impulse wave could send NQ up toward the $13,500 level, but we would need to clear above the most recent highs at $13,346 in order for that to be a possibility.
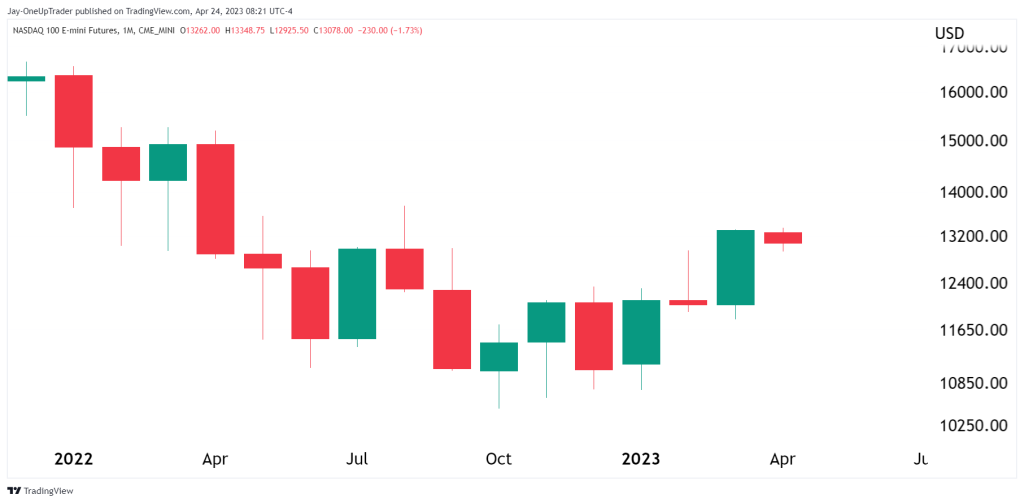
Monthly Chart
The monthly chart closed with a large green bodied candle for the month of March. April is nearly over now and the candle is an interesting one. It is a small ranged candle that is remaining within the range of the green candle. If it closes like in the image below, it would be a bullish sign and I would see a higher probability of May closing with a green candle than a red one.