Follow-Up: What Played Out Since August 5 Analysis
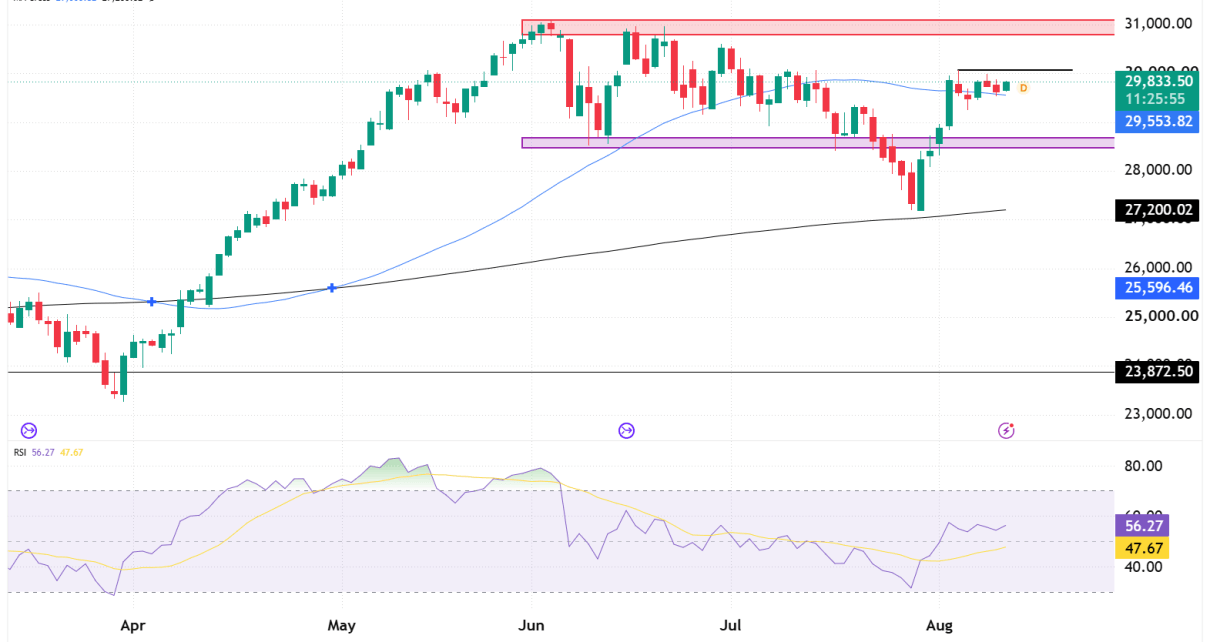
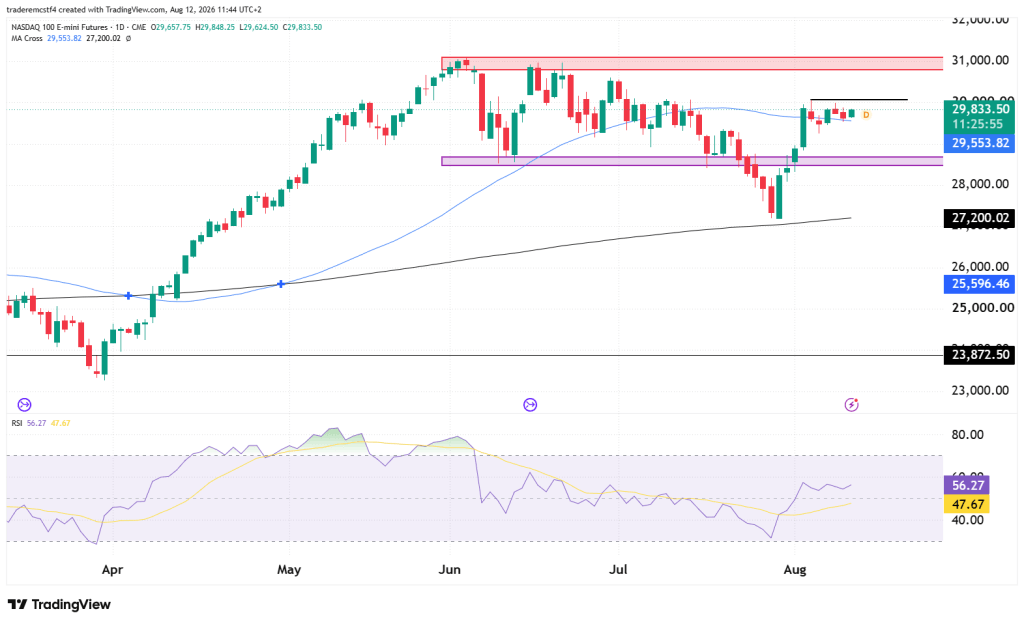
We flagged 30,000 as the level to watch in our last analysis on Nasdaq, with a close above it opening the door to 30,300 and the June highs. Price never got there. Instead, NQ spent five sessions grinding sideways beneath that number, closing at 29,794.75 — 101 points below where we left it, with the entire week contained inside a range of roughly 350 points. This is something we can expect because of the rally we saw from 30 July to 4 August. In other words, the consolidation period we see now is healthy, and price looks like it’s coiling up for another leg higher, which, if we see that, will likely target the ATH.
The question now is whether this is consolidation before another leg toward the record highs, or a market quietly running out of buyers under a level it cannot clear.
The CPI Print, in Context
A few points worth flagging:
- The market has been waiting on a single data point. July CPI was released Wednesday, August 12 at 8:30 a.m. ET, with economists expecting headline inflation near 3.4%, slightly cooler than June’s 3.5%. The chart above reflects the session ahead of that print.
- The stakes are higher than usual after last week’s jobs miss. A hotter-than-expected reading could push Kevin Warsh toward supporting a September rate hike at the FOMC’s September 15-16 meeting, which would undercut the assumption the August rally was built on. July’s roughly 21% rise in oil prices is the specific pressure feeding into the number.
- Positioning confirmed the standoff. Nasdaq 100 realized volatility near 25.5% annualized was cited as a sign of low conviction and a high probability of choppy, sideways trading, with thin summer volume and elevated Treasury yields adding to the drift.
The bigger picture: this is a market deferring a decision rather than making one. The levels below still matter, but the catalyst that resolves them sits outside the chart.
Key Support and Resistance Levels
Major Resistance
| Level | Notes |
|---|---|
| 30,000 | Round number that has capped every attempt for five sessions |
| 30,300 | Mid-July lower high |
| 30,900 – 31,100 | June high zone, the record area |
Major Support
| Level | Notes |
|---|---|
| 29,553 | Faster moving average, rising into price from below |
| 29,000 | Round-number support, untested since the breakout |
| 28,600 – 28,900 | The shelf that launched the August rally |
Possible Trades
Bullish breakout
- Entry trigger: daily close above 30,000
- Stop: below 29,553
- Target: 30,300 initial, 30,900–31,100 extended
Breakdown
- Entry trigger: daily close below 29,553
- Stop: above 30,000
- Target: 29,000 initial, 28,900 extended
Invalidation / range scenario
- Continued chop between 29,553 and 30,000 should be read as a market still waiting rather than one that has failed
- Because the resolution comes from data rather than the chart, the first move on the print is as likely to reverse as it is to follow through — waiting for the daily close is worth more than usual here
- PPI lands Thursday, with retail sales and consumer sentiment behind it
Summary
NQ has held its August gains without extending them, spending five sessions in a 350-point range beneath 30,000. The structure stays constructive while 29,553 holds, and 30,000 remains the level that decides the next leg. What separates this from a routine consolidation is that the resolution is likely to come from the inflation data rather than from anything on the chart.
Trading futures involves substantial risk of loss and is not suitable for all investors. Past performance is not indicative of future results. This analysis is for informational and educational purposes only and does not constitute financial advice. Always conduct your own due diligence and consult with a licensed financial advisor before making any trading decisions.