Introduction
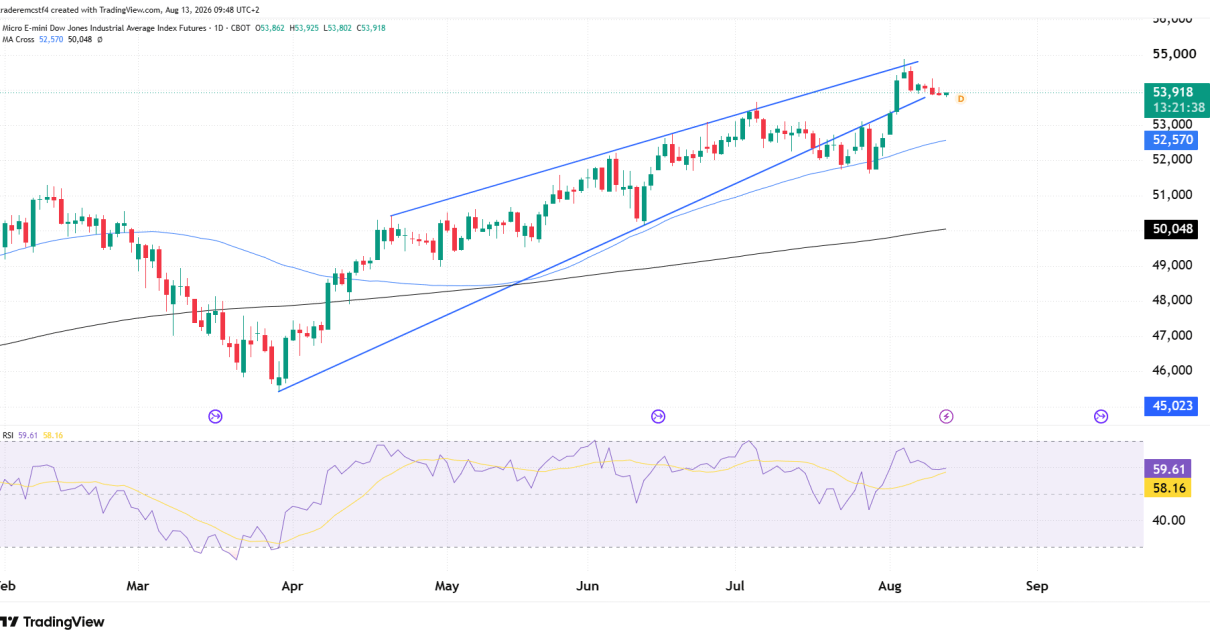
The Dow was the one major index that did not celebrate the July inflation report. While the S&P 500 opened at a record high and the Nasdaq closed up 0.54% on August 12, the Dow settled at 53,770.27 — down 21.58 points, or 0.04%, on a day the data went its way. YM has spent six sessions drifting back from its early-August high near 54,600, and price is now resting on the lower boundary of the rising wedge that has guided this entire advance since April.
The question is whether that boundary holds the way it has all summer, or whether the gap between price and momentum finally resolves the way rising wedges usually do.
Trend Analysis
The structure since the April low near 45,800 is a rising wedge: a steep lower trendline connecting the higher lows, converging with a shallower upper trendline that has capped every rally along the way. Price sits at 53,922 after fading from 54,600 across six sessions, with the session low at 53,802 landing directly on that lower boundary. Both moving averages remain well below and rising — 52,571 and 50,048 — so the broader uptrend itself is not in question.
Another thing to look at is the small range of sessions the past few sessions. This was after a big rally and could mean that the market is gearing up for another move higher, and this squeeze could mean it breaks out with a lot of power.
The CPI Print, in Context
The data that markets had been waiting on arrived and removed a risk rather than creating one. A few points worth flagging:
- July CPI landed exactly on consensus. Headline inflation rose 0.1% on the month for an annual rate of 3.4%, down from 3.5% in June, while core CPI rose 0.2% for an annual 2.5% — the lowest core reading since February. Both remain above the Fed’s 2% target.
- The print cooled September hike expectations. CME FedWatch data showed the probability of a September rate hike falling to 40.1% from 54.4% a week earlier, after three dissenters at the last meeting had voted to raise.
- The Dow did not participate in the relief. Oil pushed back above $83 a barrel as hopes of a Strait of Hormuz reopening faded, and the index closed fractionally lower while the S&P and Nasdaq advanced.
The bigger picture: the inflation risk hanging over the market eased, but the Dow’s composition means it captures less of that relief than tech does. The index is holding near record levels without the momentum the Nasdaq found on the same news.
Key Support and Resistance Levels
Major Resistance
| Level | Notes |
|---|---|
| 54,000 | Round number immediately overhead, capping the pullback |
| 54,600 | Early August high and the record area |
| 55,000 | Upper wedge boundary at its current projection |
Major Support
| Level | Notes |
|---|---|
| 53,802 | Session low, sitting directly on the lower wedge boundary |
| 53,000 | Round-number support and the mid-July consolidation shelf |
| 52,571 | Faster moving average, rising into the range from below |
Possible Trades
Wedge holds
- Entry trigger: daily close back above 54,000, ideally reclaiming 54,600
- Stop: below 53,802
- Target: 54,600 initial, 55,000 extended at the upper boundary
Wedge breaks down
- Entry trigger: daily close below 53,802
- Stop: above 54,600
- Target: 53,000 initial, 52,571 extended
Invalidation / range scenario
- Continued drift between 53,800 and 54,000 without a decisive close either side should be read as the wedge still tightening, which by definition cannot continue much longer
- July PPI lands Thursday with retail sales behind it on Friday, so a boundary break driven by data rather than by structure remains the more likely path
- Rising wedges resolve lower more often than not, but that is a tendency rather than a rule — trade the break, not the pattern
Summary
YM is holding just above the lower boundary of the rising wedge that has carried it since April, with both moving averages far below and still climbing. The concern is not the trend but its quality: a converging wedge and an RSI that failed to confirm the early-August high both point to an advance running short of fuel. A close below 53,802 would be the first real evidence of that, while a move back above 54,600 keeps the pattern intact toward 55,000.
Trading futures involves substantial risk of loss and is not suitable for all investors. Past performance is not indicative of future results. This analysis is for informational and educational purposes only and does not constitute financial advice. Always conduct your own due diligence and consult with a licensed financial advisor before making any trading decisions.