

- CL suffers a 9% decline in just two days, as suspected.
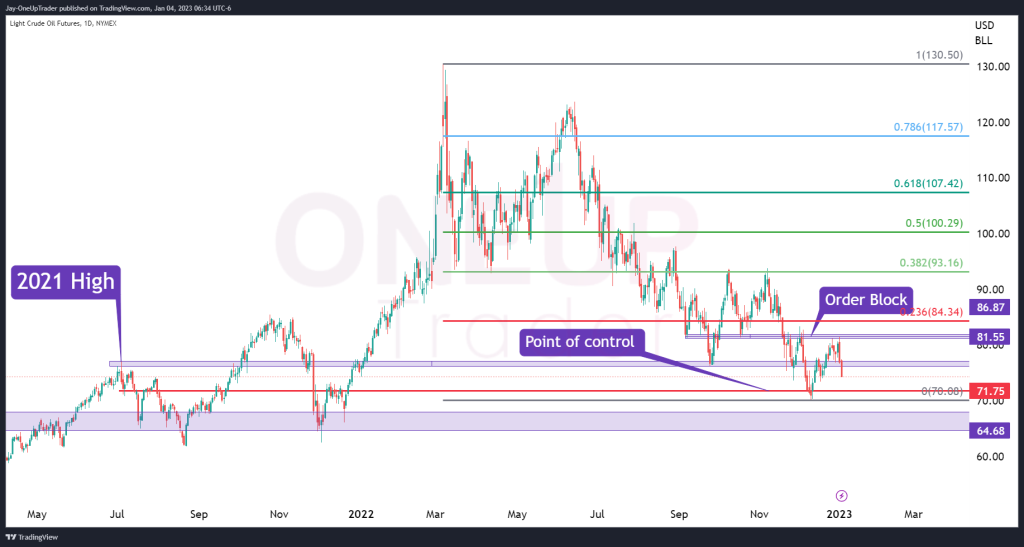
- Analyzing the order block responsible for multiple price rejections at $81.55.
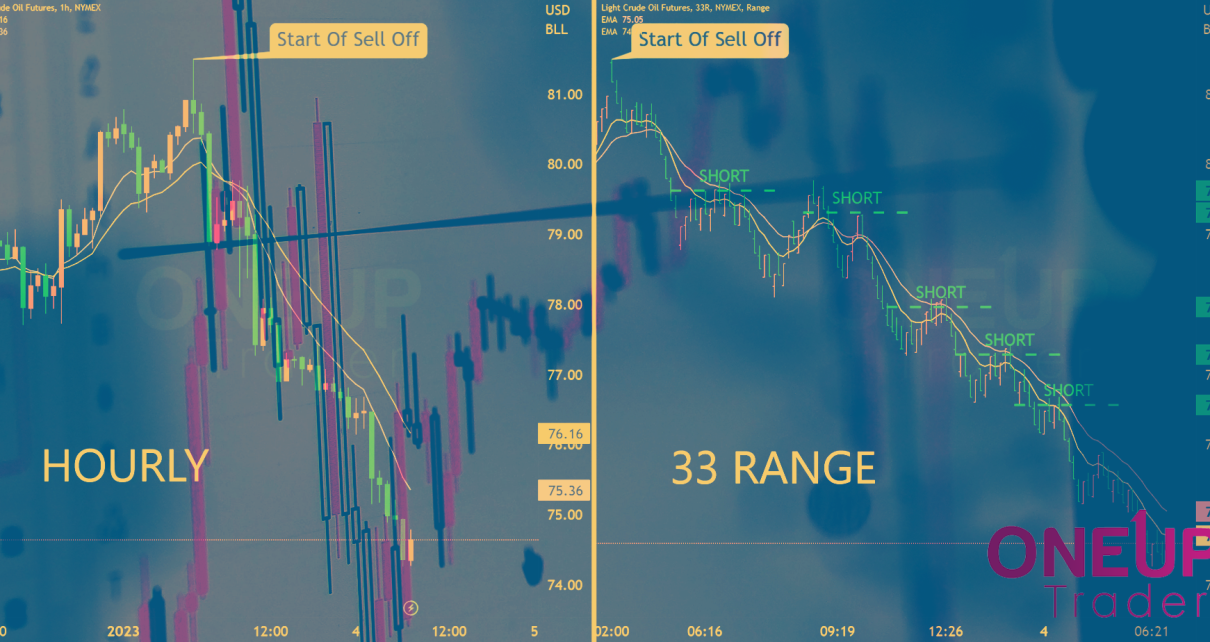
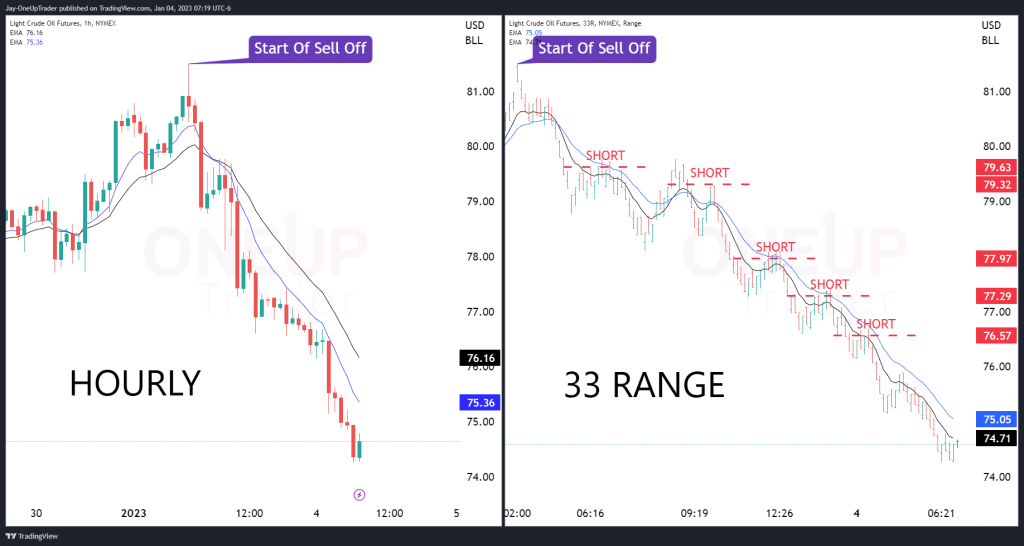
- Evaluating the differences between time-based and range charts in a trending market.
Quick Recap
Before the end of the year, we looked at possible bearish targets around $67.98. CL dipped from $75 to $70 shortly after publishing the article but never reached the maximum target. From now on, I will be more reserved in the targets we aim for. That said, CL has begun to sink, and the $67.98 target has become a possibility once again.
CL Drops 9% After Testing Order Block
Yesterday’s session saw Crude drop by 6% as it tested a small order block I noticed on the daily chart. The order block sits at $81.55 and has been tested multiple times, each being a turning point for price.
In today’s session, CL has already dropped 3.72%. The next, most immediate target for bears is the Fib 0% level at $70.08. The volume profile point of control is also very close to this Fib level. It’s safe to assume that we could see some support at these levels, but the question is whether it will be enough to delay the rampant bears this time. This is the 2022 low, so if a significant close occurs below this level, we could see the price fall more rapidly.
If the current lows at $70 are broken, the next significant support level at $64.68 will likely be the next stop. See the image below.
The 33 Range Chart On CL
Range charts focus on an asset’s high and low prices over a given period rather than the specific times when those price movements occurred. This can be useful for identifying patterns in the price of an asset, especially in trending markets.
In the chart below, you can see the price movement of crude oil on the hourly chart compared to the 33 range chart. The range chart provides more significant opportunities for traders to enter on retracements, especially when two moving averages are applied, while the hourly chart has little to no entry opportunities.
Range charts remove time from the calculation by only displaying an asset’s high and low prices over a given period rather than plotting the prices on a timeline as time-based charts do. This means that the distance between two points on a range chart does not represent a specific amount of time but rather the difference in price between the high and low over a certain period.
Summary
Crude oil futures (CL) have dropped 9% over the past two days. The next support level is $64.68 if the current lows at $70 are taken out. The EIA Petroleum Status Report coming out tomorrow is a weekly report published by the United States Energy Information Administration (EIA) that provides detailed information on the status of the U.S. petroleum industry. It will likely cause a lot of volatility, and CL traders should be cautious at that time as most strategies will become redundant.