

The Daily chart shows signs of a rollover. Gaussian channel, candlestick, and Fibonacci analysis on the Daily chart. There is a potential Marg Simpson pattern on the 4-Hourly chart. Medium Term Outlook The Equity markets have enjoyed a rebound spurred on by the fall in the price of the Dollar. The three main aspects to Read More…
Month: November 2022
E-mini Nasdaq-100 (NQ) Futures Prices Climb as US Inflation Outlook improves
US producer prices increased by 8%, lower than expected, in the year ending October. Despite declining US wholesale service prices in October, service inflation remains high. NATO allies are looking into claims that Russian missiles killed two people in Poland. The E-mini Nasdaq-100 (NQ) futures made gains on Tuesday as investors jumped on softer-than-expected inflation Read More…
Technical Analysis: Euro Fx (6E) Surges Through Downward Channel
6E has surged through the long-term down channel. The most apparent price zones to watch in the medium term. Fibonacci Fan Analysis on 1-Hourly chart. Euro Surges Out Of Downward Channel Due To a Weakening Dollar We have been tracking the Euro’s downward channel for some time now, and for a while, it seemed the Read More…
Order Block Trader Withdraws $15,000 – Unique Strategy Revealed!
Who Is He & Why He Chose OneUp Trader Jipson is a veteran trader from Wisconsin who completed the $50,000 Evaluation this year. He believes OneUp Trader offers the best deals in the industry, with a one-step evaluation, a flexible daily loss limit, and less restrictive maximum drawdown parameters. Jipson loves the 24/7 customer support Read More…

Technical Analysis: Gold Soars 10% In One Week
Gold prices trading the major support zone on the monthly chart Potential bullish targets. RSI showing overbought in the short run. Bull flags and the Gaussian channel on the hourly chart. Monthly View We did a piece a few months ago on the multi-year support zone in Gold between $1,674.1 and $1715.5 here. The Gold Read More…
Equity Futures Price Rally Pauses as CPI-led Optimism Fades Out
The bull rally has paused on hawkish statements from Fed policymakers. Democrats have retained the majority in the US Senate. A Democratic sweep might resurrect concerns about spending and legislation. Major US Equity futures index prices including the S&P 500 (ES) futures closed lower on Monday while US bond yields increased, anticipating the continuation of Read More…
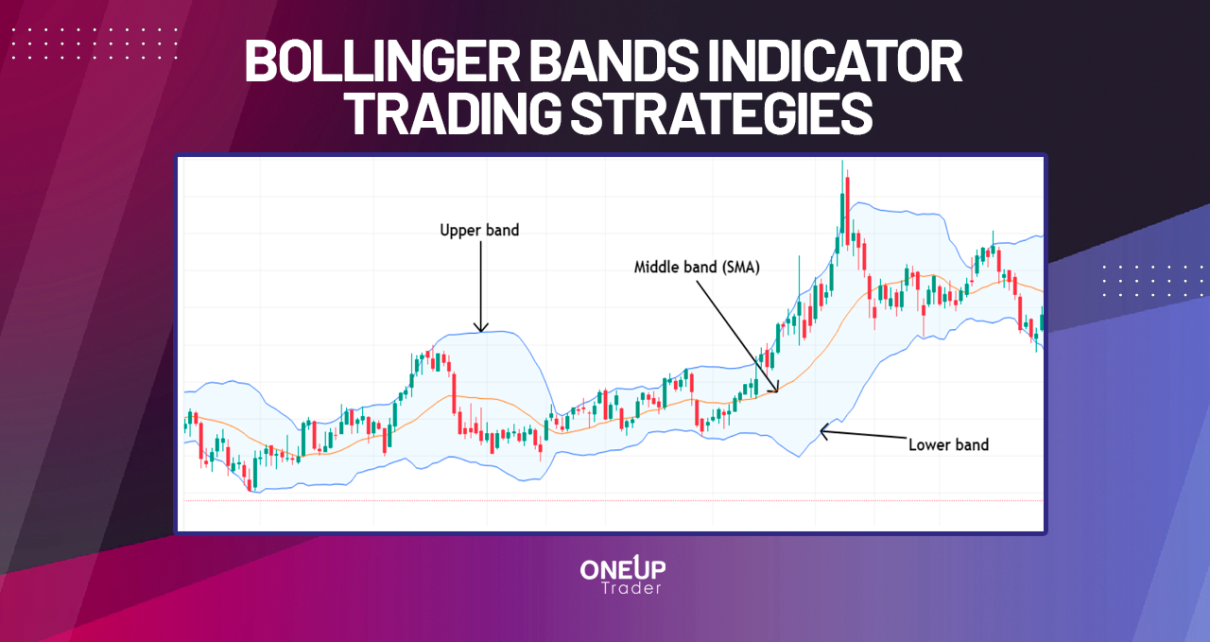
Bollinger Bands Indicator Trading Strategies
Market volatility is an important aspect of price action trading, and with the Bollinger Bands indicators, you can easily visualize an asset’s volatility. It shows how the price fluctuates around an average value, in this case, around a moving average. By the end of this guide, you should understand how the Bollinger Bands indicator works, Read More…
British Pound (6B) Futures Trim Losses as Optimism Stems from UK’s Budget
Dollar weakness after the US inflation report boosts the British pound futures. The UK economy shrank in September, signaling the start of a possibly long recession. Markets are awaiting the new budget by Jeremy Hunt. On Friday, the British Pound (6B) futures prices gained ground for a second day on expectations that the Federal Reserve Read More…

Crude Oil (CL) Futures Analysis – Head & Shoulders Neckline Tested
The Neckline of the Inverse Head & Shoulders pattern Daily chart is tested. Fibonacci targets revisited from last week. Price zones to keep in mind while trading today’s session. Quick Recap In our analysis from last week, the Head & Shoulders and Parabola were the main focus. CL price has broken the Parabola, which signals Read More…
E-mini Nasdaq 100 Forms a Double Bottom Pattern After Bullish CPI Report
Better-than-expected CPI report shows inflation may have peaked. A Double Bottom pattern forms on the Daily chart. Bull, Bear, and Crab trade scenarios. The CPI Report The November Consumer Price Index (CPI) Report released on Thursday shows that inflation may have peaked. Prices increased 0.4% month-on-month, and prices less food and energy rose 0.3%. These were low Read More…