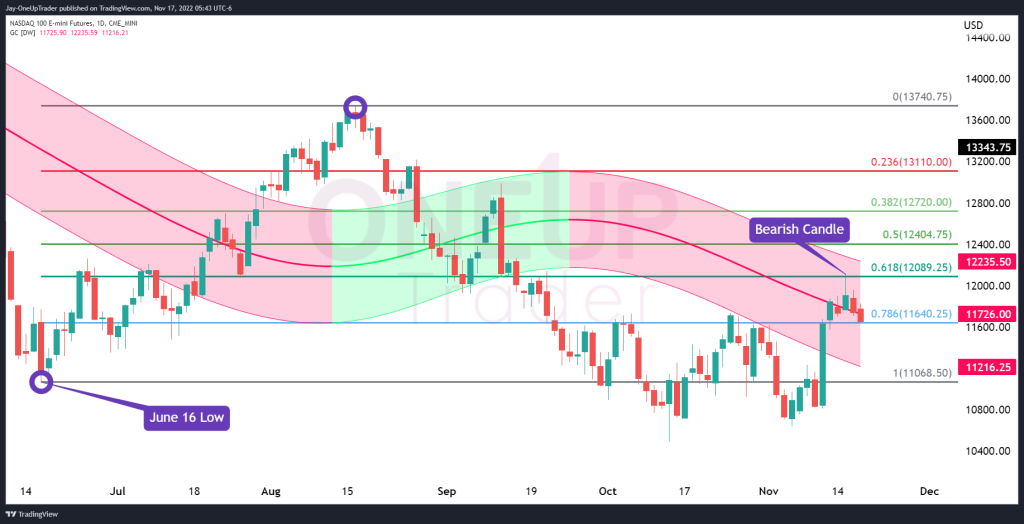
- The Daily chart shows signs of a rollover.
- Gaussian channel, candlestick, and Fibonacci analysis on the Daily chart.
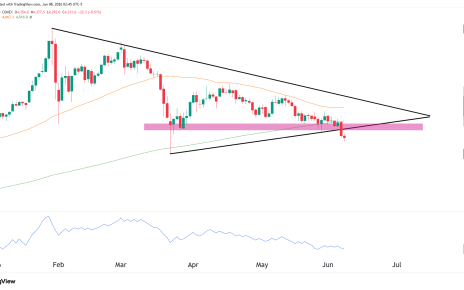
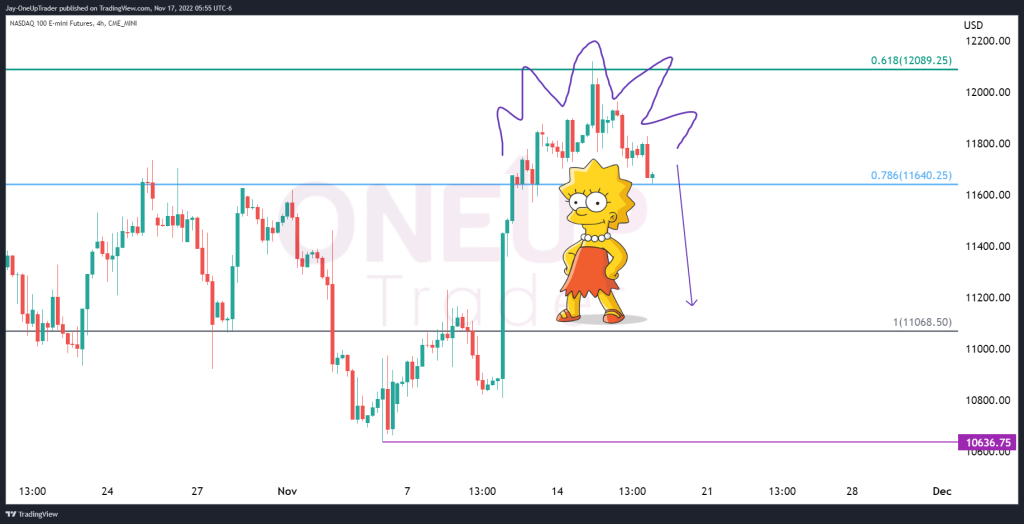
- There is a potential Marg Simpson pattern on the 4-Hourly chart.
Medium Term Outlook
The Equity markets have enjoyed a rebound spurred on by the fall in the price of the Dollar. The three main aspects to focus on when analyzing the Daily chart are the Gaussian channel, the bearish candlestick pattern from November 15, and the Fibonacci levels.
Gaussian Channel
The daily chart has retraced into the Gaussian channel, finding resistance around the 50 line.
The Bearish Candle
The candlestick from November 15 resembles an inverted hammer; however, the candle’s body is slightly too big. This does not take away from the bearish appearance of the candle. It has a large wick to the upside, which fell after testing the 61.8% Fib retracement.
Fibonacci Levels
The two main Fibonacci levels we are monitoring are 61.8% ($12,089.25) and 78.6% ($11640.25). At the time of writing, NQ is trading right on the 78.6% level, and time will tell whether it will act as support. We could see the price bouncing between these two levels if it does.
Marg Simpson Pattern
The Marg pattern is very similar to the Bart pattern in that we see a strong price move, followed by a ‘spiking’ consolidation period resembling Marg’s hair, then a steep fall. The pattern can be found on the 4- hourly chart and has not been confirmed yet. Stop losses could be placed above the high of the pattern with targets at the 100% Fib level ($11,068.50) or at $10,636.75.
Summary
The technical analysis on NQ shows signs that bears are slowly starting to creep back in. The bearish candlestick on November 15 is our temporary high, and if prices break above that level, momentum will quickly shift back into the Bull’s favor. If the Marg pattern confirms, we will have to monitor what price action does around the lows at $11,000.