

Market volatility is an important aspect of price action trading, and with the Bollinger Bands indicators, you can easily visualize an asset’s volatility. It shows how the price fluctuates around an average value, in this case, around a moving average. By the end of this guide, you should understand how the Bollinger Bands indicator works, be able to determine overbought and oversold conditions, and forecast possible market breakouts.
What is the Bollinger Bands Indicator?
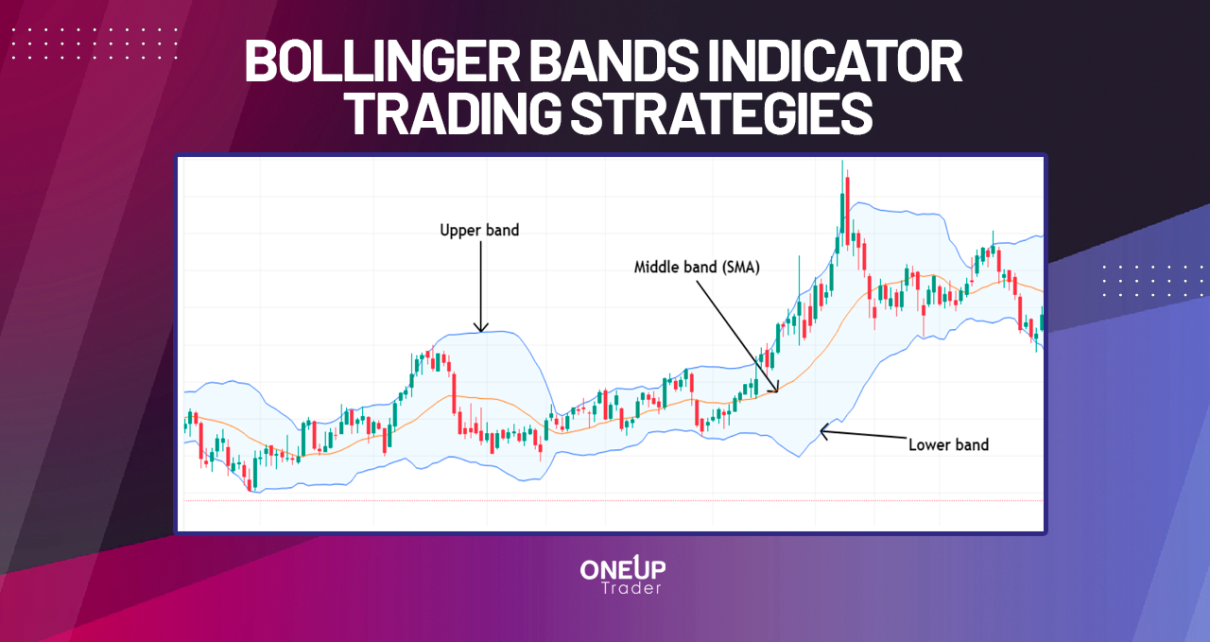
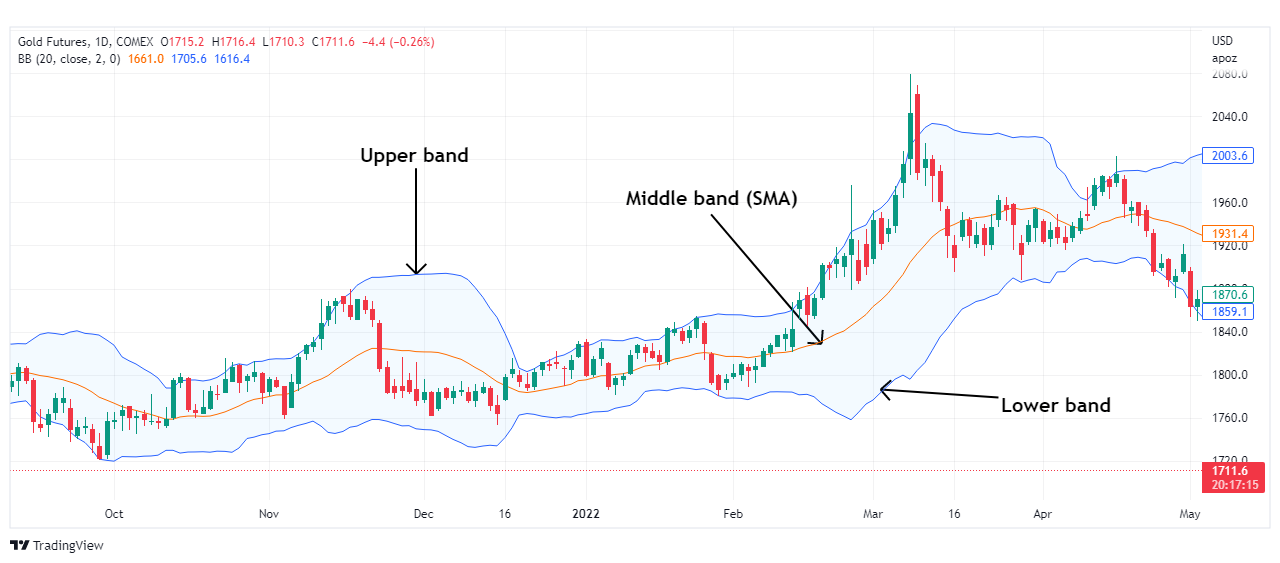
The Bollinger Bands is a technical indicator designed to show the price action’s volatility. Developed in the 1980s by John Bollinger, the indicator is used to determine when an asset is oversold and overbought. Specifically, it’s focused on an asset’s moving average value and the standard deviation of its price. It comprises three lines – the upper, middle, and lower bands.
The middle line is a simple moving average (SMA). It shows the asset’s trend in the medium term by determining its moving average value over a pre-determined period, usually 20 periods.
The upper and lower bands indicate the asset’s volatility by measuring its price’s relative highs and lows in relation to previous trades. The upper and the lower bands widen or narrow depending on the changes in the volatility. This volatility is measured using standard deviation.
How to Calculate Bollinger Bands
While you’ll never have to calculate Bollinger Bands, knowing its formula goes a long way to understanding the various Bollinger Bands trading strategies.
As we’ve mentioned, the Bollinger Bands indicator has two main components, the SMA and the standard deviation. The SMA determines the asset’s average price over a specified period; this is usually 20 periods by default. That means the asset’s closing price at each period (could be minutes, hours, days, or months, depending on the selected timeframe) is added and divided by 20.
The standard deviation is a statistical concept that describes how prices are dispersed around the SMA. Once you’ve established the SMA, the standard deviation of the closing price is calculated over the same period as used in the SMA. This standard deviation is multiplied by a factor, usually 2, then added or subtracted from the moving average.
The upper Bollinger band = 20-period SMA + (20-day standard deviation x2)
The lower Bollinger band = 20-period SMA – (20-day standard deviation x2)
As stipulated by John Bollinger, when using a shorter-term timeframe of 10-period SMA or less, you should adjust the multiplication factor of the standard deviation to 1.5 instead of 2. Similarly, for longer-term timeframes above 50-period, adjust the standard deviation factor to 2.5.
Generally, the positioning of the upper and lower bands shows the strength of the prevailing trend and offers insights into possible support and resistance in the immediate future. We’ll discuss these later on.
How to use Bollinger Bands in Trading
As we’ve mentioned, the Bollinger Bands indicator shows asset volatility. And that means we can use different Bollinger Bands trading strategies to determine regions of potential breakouts and reversals.
The top Bollinger Bands indicator trading strategies include the double bottoms and double tops, reversals, and the Bollinger Bands squeeze.
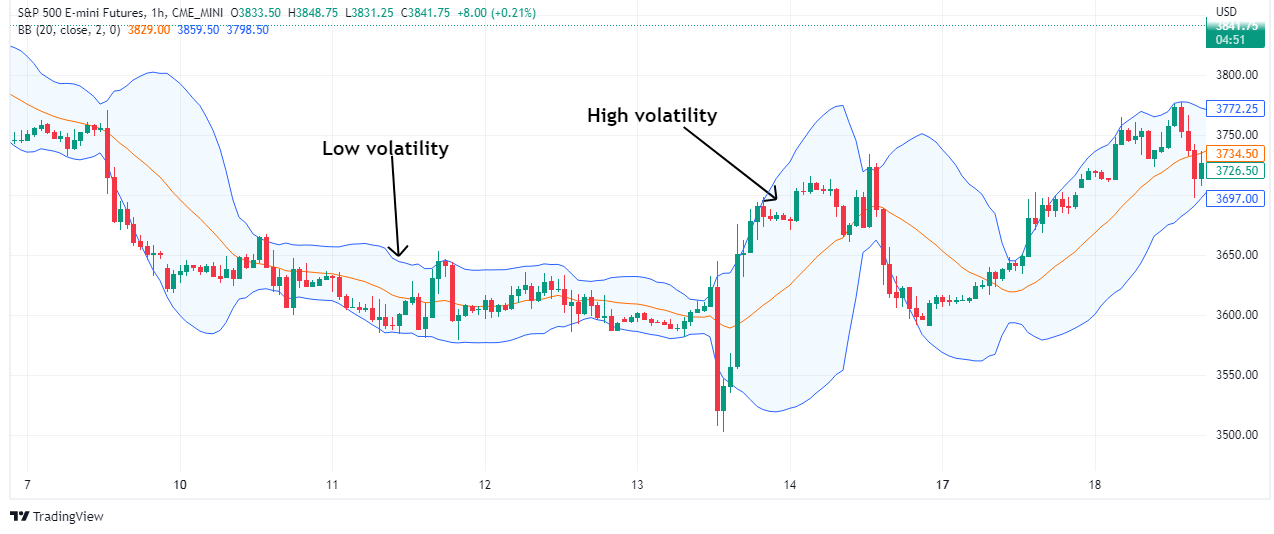
Here are a few things to keep in mind. A wide Bollinger Bands indicate that the market is volatile, and the wider it is, the more volatile the market is. Typically, the bands widen during high volatility to ensure that the price fluctuation is contained within the bands. And with this logic, we can always expect the price to bounce within the upper and lower bands.
Conversely, narrow Bollinger Bands show low volatility – the upper and lower bands contain the price within a range. A volatile price breakout usually accompanies this Bollinger Bands squeeze.
Bollinger Bands Reversals
With the Bollinger Bands reversal trading strategy, the vital thing to remember is that the upper band represents the overbought region, while the lower band is the oversold region. This strategy means that the lower and upper bands act as support and resistance regions. And going by the mean reversion theory, we can expect that the price will always return to its average.
Generally, when the distance between the bands is widening, it implies that the market volatility is increasing, and the prevailing trend could be ending. In this case, when an asset’s price reaches either band in times of high volatility, you should anticipate a reversal toward the indicator’s SMA.
A common mistake with most traders is shorting the market as soon as the price reaches the upper band or going long immediately after the price reaches the lower band. Note that the price can continue forming higher highs along a widening upper band. Similarly, it could also hit lower lows with the lower band trending lower.
Bullish Bollinger Bands Reversal
A bullish Bollinger Bands reversal occurs when the price action has a strong momentum heading into the support region. That means the candles are closing outside a widening lower band.
To establish the ideal entry for a long position, look for potential bullish reversal candlesticks or chart patterns. This will add confluence to the fact that the price action is likely to reverse into an uptrend.
In this case, your profit target should be at the immediate previous high around the upper band. The stop loss should be below the bullish reversal pattern.
Alternatively, you may use the average true range (ATR) indicator to establish the ideal profit and stop targets based on the prevailing volatility.

Bearish Bollinger Bands Reversal
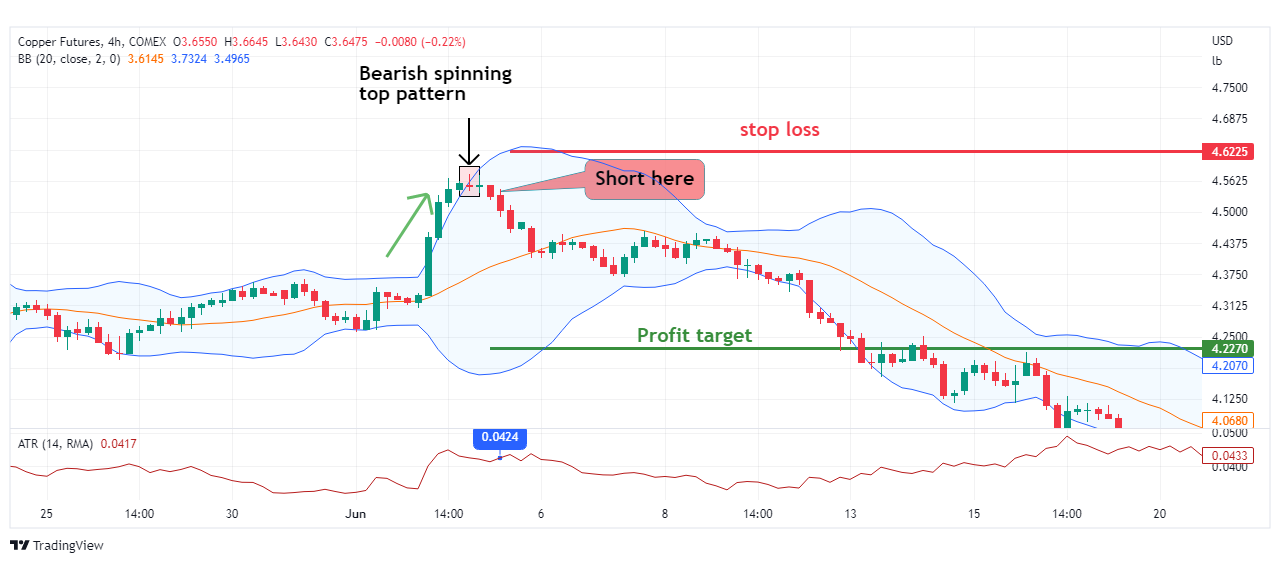
A bearish Bollinger Bands reversal occurs when the price action has a strong momentum heading into the resistance region. That means the candles are closing outside a widening upper band, indicating that the buyers are overstretched.
To establish the ideal entry for a short position, lookout for bearish reversal candlesticks or chart patterns. They indicate that the bullish price action will likely reverse into a downtrend.
For the short position, your profit target should be at the immediate previous low around the lower band. The stop loss should be above the bearish reversal pattern.
You can also use the average true range (ATR) indicator to set the profit and stop targets based on the prevailing volatility.
Bollinger Bands Double Tops Trading Strategy
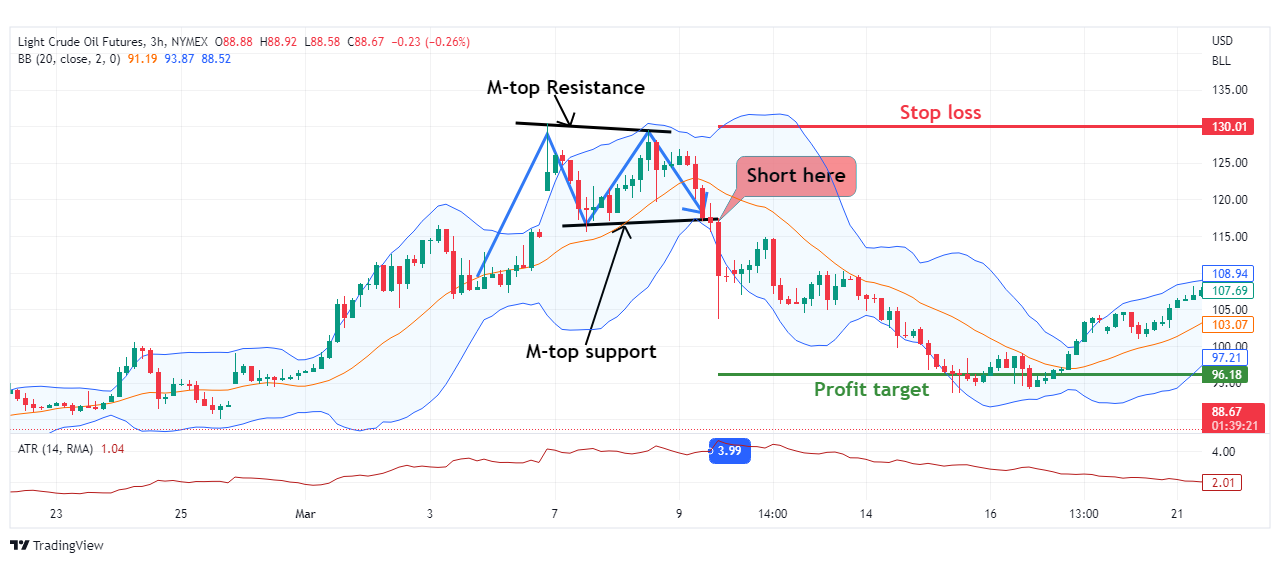
This strategy is called the Bollinger Bands M-top trading strategy. It is a bearish reversal trading strategy.
The M-top forms when the price closes close to or above the upper band but then pulls back to the SMA but doesn’t trend significantly below it. This forms the support level. After the pullback, the price rallies back to the upper band, but the bulls don’t have the momentum to push it beyond the initial resistance. It shows that the bullish trend is weakening.
With the Bollinger Bands double top strategy, the entry point for a short position should be immediately below the support formed after the initial pullback. The stop loss will be around the resistance, while the profit target will be determined by the ATR.
Bollinger Bands Double Bottoms Trading Strategy
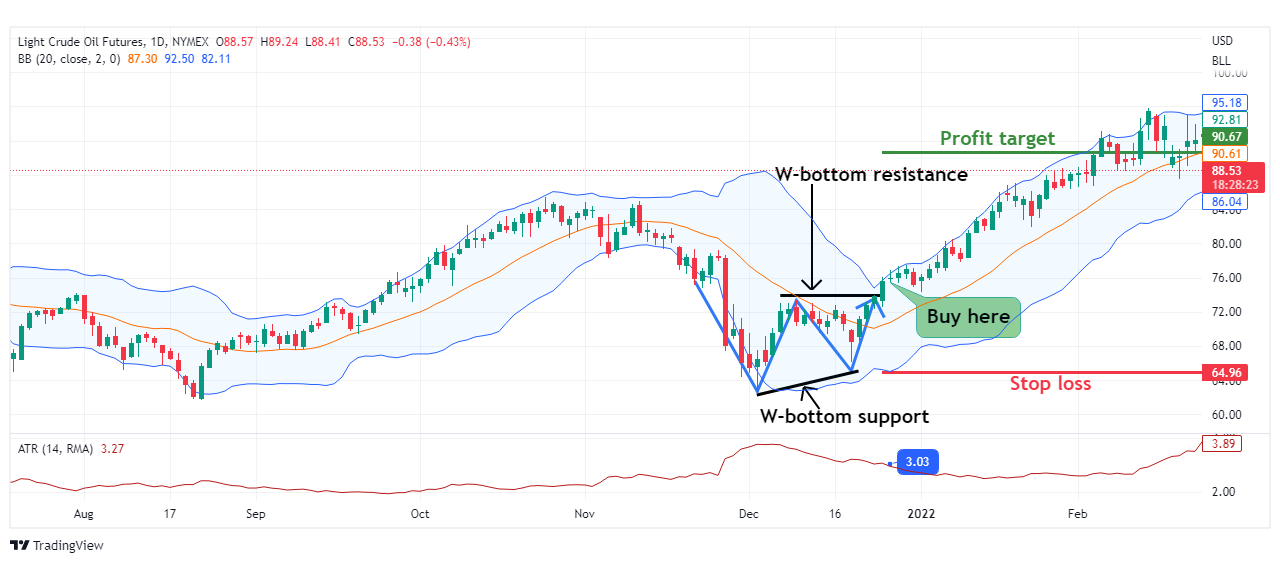
The Bollinger Bands double bottoms trading strategy is also called the Bollinger Bands W-bottom. It is a bullish reversal trading strategy.
The W-bottom forms when the price closes near or below the upper band but then rallies back to the SMA. This automatic rally doesn’t go significantly above the SMA, forming a resistance level. After the rally, the price drops, attempting to retest the previous lows. However, the bears don’t have the momentum to push the price further down. This shows that the bullish trend is weakening.
With the Bollinger Bands double bottoms strategy, the entry point for a long position should be immediately above the resistance formed after the automatic rally. Use the ATR value to determine the profit target, while the stop loss should be around the double bottom’s support.
Bollinger Bands Breakout Trading Strategy
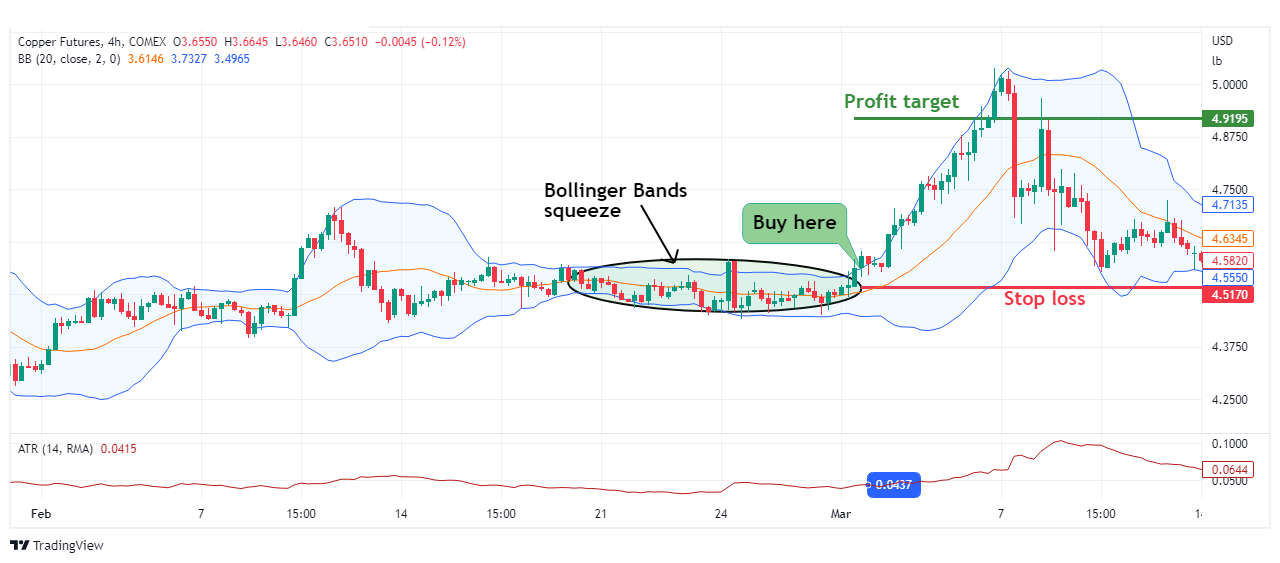
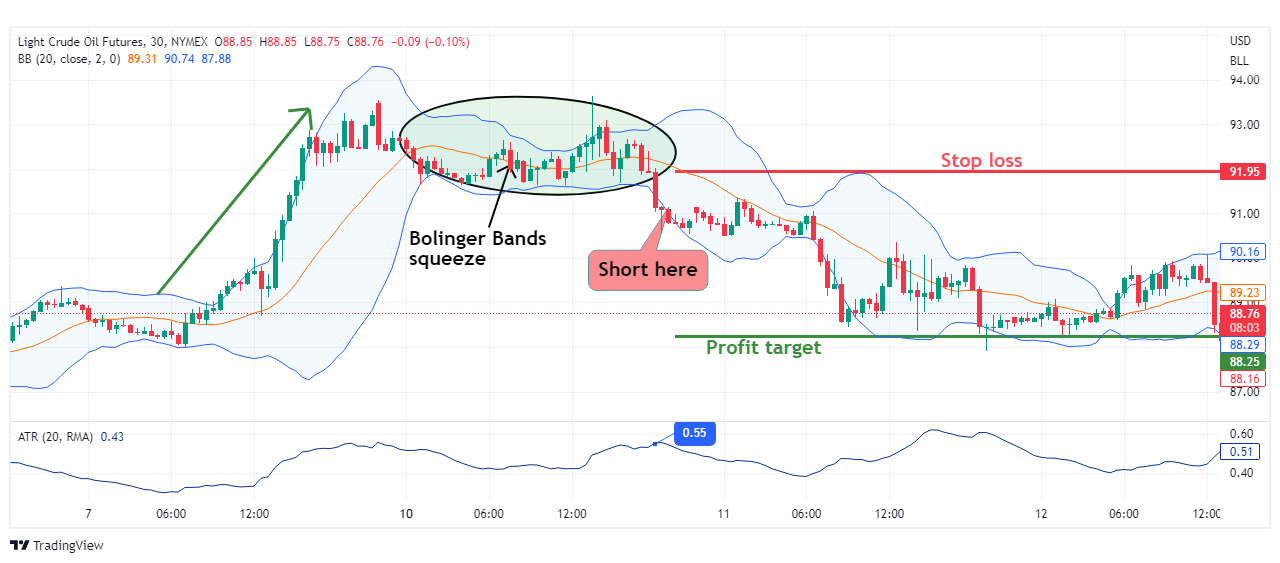
The best time to prepare for breakout trading is during the Bollinger Bands squeeze. The squeeze occurs in a time of low market volatility. As a result, the upper and lower bands tighten with the asset trading within a narrow horizontal range forming support and resistance. And this increases the likelihood of a sharp price breakout in either direction.
As with any breakout trading strategy, always pay attention to false breakouts.
Bullish Bollinger Bands Breakout
A bullish breakout occurs when there’s increased market volatility after a squeeze, with the middle band (SMA) trending upwards. In this case, the price rises above the level of the preceding Bollinger Bands squeeze. However, you should wait for the subsequent candles to open and close above the squeeze before going long.
For a bullish breakout, place your stop loss target just below the upper band. And use the ATR indicator to set the profit target.
Bearish Bollinger Bands Breakout
A bearish breakout occurs when there’s increased market volatility after a squeeze, with the SMA steeply dropping. In this case, price action drops below the preceding Bollinger Bands squeeze. But you shouldn’t short the market immediately after the price breaches the lower band – wait for the subsequent candle to open below the squeeze.
For the bearish breakout, place your stop loss target immediately above the lower band. And use 50% of the ATR value to set the profit target.
The Bottom Line
Since the Bollinger Bands indicator measures an asset’s volatility, the upper and lower bands for dynamic resistance and support levels. And throughout this guide, we’ve discussed how you can use Bollinger Bands to implement reversal and breakout trading strategies.

