Volatility is an important part of trading. It is related to risk but also, in some cases, opportunity. This article will explain how to get a directional bias in the equity futures market by using a gauge for volatility called the VIX indicator. Volatility analysis is both quantitative and psychological in nature because it uses complex calculations to understand the level of fear and greed in the market.
It may, therefore, also be a part of sentiment analysis. This article will present the Volatility Index (VIX) and how we can use it to approximate the market’s next direction. It is an essential add-on to our trading framework.
Introduction to Volatility
Volatility is extremely important in the financial markets, and predicting
it will improve trading skills. We will learn a way to use the VIX indicator as
a fear sentiment indicator to try to understand how equity participants feel
about the stock market’s state. That is to say, these techniques might not
present much predictive power as much as they are explanatory; after all,
knowing the environment is also part of trying to predict the future.
Before commencing directly with the VIX indicator, we need to introduce financial derivatives briefly.
A derivative is an instrument or contract that derives its value from an underlying asset, rate, or anything that has value (even weather and electricity can have derivative contracts). Derivatives are one of the main innovations in finance and have played lead roles in many historical events. We will discuss three main types of financial derivatives:
- Forwards.
- Futures.
- Options.
FORWARDS
The forwards and futures markets have been created mainly for producers and hedgers to reduce price risk from their daily operations. Imagine an airline company that buys gasoline to operate its planes.
Naturally, it will not want gasoline prices to go up because that will hurt its profits. So, it can go long a futures or forward contract on gasoline prices so that when they go up, the gains from the contracts offset the losses incurred when buying the gasoline for usage. That is what we call hedging. A forward contract is an over-the-counter contract between two parties to pay a fixed price and deliver the asset at a pre-determined date in the future.
Over-the-counter means that the contract is not guaranteed by a clearinghouse, and hence, forward contracts carry default risk, as they are not valued daily.
FUTURES
These contracts are exactly the same thing as forwards except that they are standardized and guaranteed by a clearinghouse and therefore do not carry a default risk (they are valued every day and require more margin to be deposited by the losing party so that the position could still be active, this is what we call a margin call). Futures are more liquid, however, at the expense of flexibility.
OPTIONS
Options, on the other hand, are rights and not the obligations to buy or sell an asset in the future at a fixed price called strike. However, they are not free (an upfront payment is required, unlike forwards and futures). This right comes at a cost that the buyer of the option pays to the seller (writer) on the inception date. We call it the option’s premium.
The main key input in options is volatility, and that is the heart of this article but for now, let us continue with our step-by-step guide. If the volatility of these options is going up, knowing that that volatility is generally negatively correlated with the asset’s returns, then this signals fear in the market.
We know that there is historical volatility (fluctuations of the asset’s returns of the previous observations) calculated through standard deviation, and there is what we call implied volatility that is not actually observed but inferred from market prices of options. It is generally a forward-looking measure and is more useful at predicting future volatility. Basic charting will allow us to see the negative correlation between the VIX indicator and the S&P500 index. It almost mirrors it.
The Volatility Index (VIX indicator)
It should be apparent now that volatility is extremely important in the
financial markets. Predicting it will significantly improve trading skills, enabling the trader to use pure volatility-betting strategies (i.e.,
straddles and variance swaps).
As we previously mentioned, implied volatility is inferred from options’ market prices and it is not calculated through a formula. Hence, if we know all of the other inputs (including the option’s price), we can measure the implied volatility by plugging into the Black-Scholes equation. But what is the VIX indicator?
The CBOE’s Volatility Index is a continuously updated (real-time) index that shows the market’s expectations for the strength of short-term changes of the S&P500. Since it is calculated from near-term options on the S&P500, it can be considered as a 30-day projection of future volatility. Rarely do we see leading time series in finance and the VIX indicator is one of them.
Using the VIX indicator to Find Equity Turning Points.
If we look at both historical data of the VIX indicator and the S&P500 since 2017, we will see the below chart. Notice the apparent negative correlation between the two as it follows the following relationship:
- The VIX indicator is rising; therefore, fear is rising, and more panic selling is occurring.
- The VIX indicator is falling; therefore, greed is rising, and more investments are being poured into the stock market.
From these bullet points, we can find a trading idea relating to buying futures on the S&P500 every time we think the VIX indicator has found resistance. A resistance level is where we expect a price drop to occur in the analyzed variable, in our case, the VIX indicator.
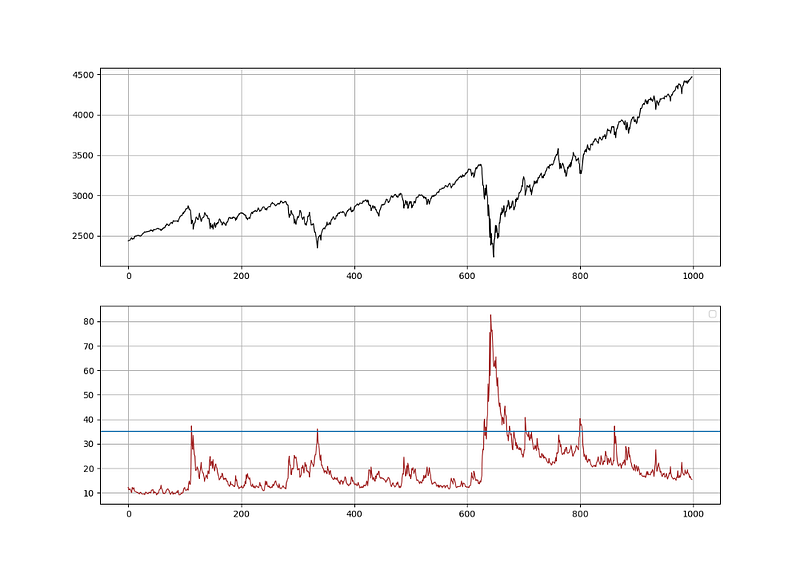
Subjectively, we can place a barrier at 35 where we see resistance on the VIX indicator with the exception of the Covid-19 mania. These will be our trading triggers for buy signals. Surely, some hindsight bias exists here, but the idea is not to formulate a past trading strategy, but instead to see if the barriers will continue working in the future.
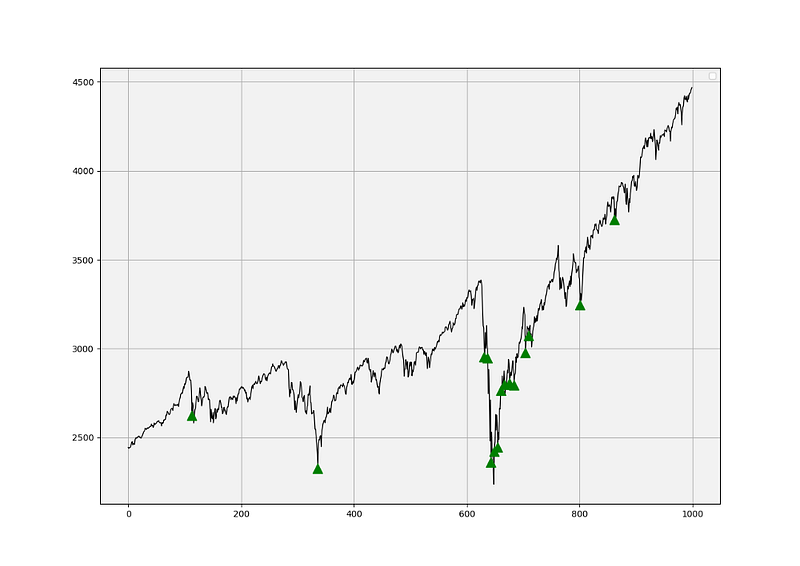
The conditions above give us the signals shown in the chart. As a buying-the-dips indicator, the VIX indicator may require some tweaking to improve the signals, but its tops tend to occur around 35, which is not far from an S&P500 bottom.
Conclusion
This article has discussed using the VIX indicator to get an approximate directional view of the S&P500. We can use the information to confirm our bias in case we have a pre-established idea on the stock market.