- Inverse head and shoulders give a tremendous guide for possible future price action.
- How traders can capitalize on the potential uptrend on shorter time frames.
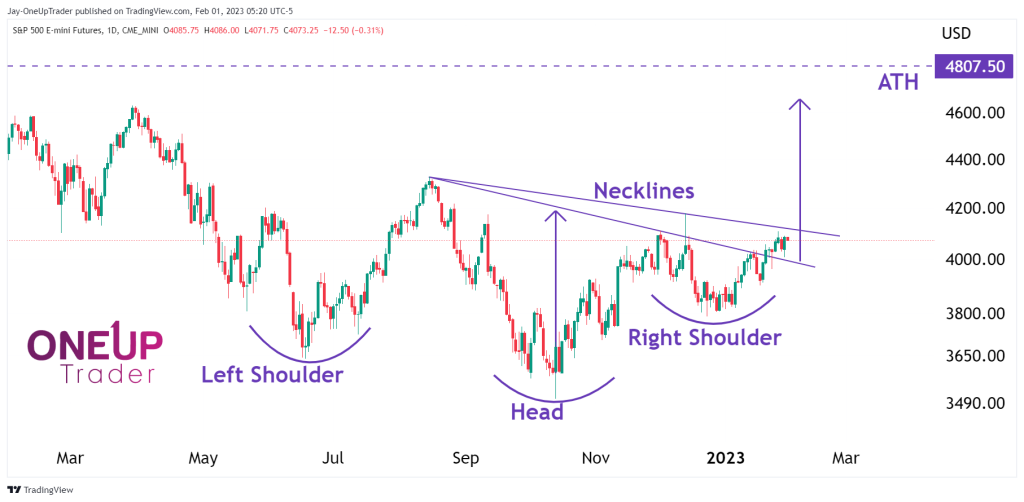
Inverse head & shoulders on the daily
A significant head & shoulders pattern has been spotted on the daily chart. There are two possible necklines that I have drawn onto the chart for us to reference. One neckline has already been broken, and the other has not.
Ultimately this inverse H&S gives us a good picture of where the overall market is heading in the next few months if it holds above the necklines in the technical analysis below.
The purpose of this article in ES is to inform you of the longer-term trend that may develop. The way traders can utilize this information is to, for example, ignore short signals on their strategy since the long-term trend is up.
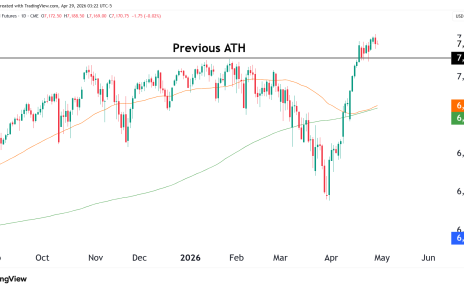
It will be interesting to see what happens with this pattern. If we see price rally above the necklines, we can almost be sure the bear market is over, and our next bullish target would be all-time high at $4,807.50.
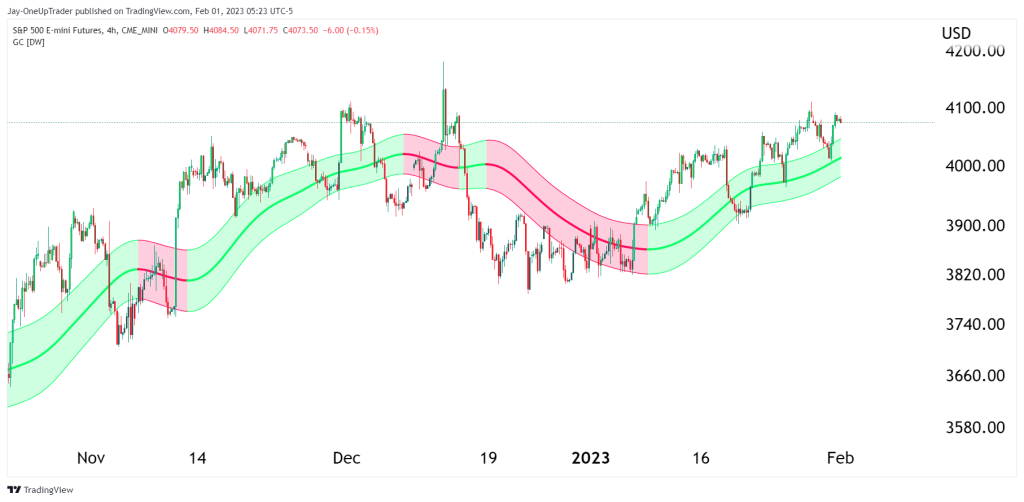
How can traders capitalize on this
Applying the Gaussian channel to the 4 hourly chart gives decent signals where we can wait for retracements into the channel or even below it. Simply dropping down time to a lower time frame of even 1 hour and looking for a bullish candlestick formation could be a great way of swing trading this move higher. Again, only if price remains above the neckline.
Quick note for readers
If there are any other markets you would like to see covered, please contact me on discord Jay-OUP#6138 or send an email to [email protected]