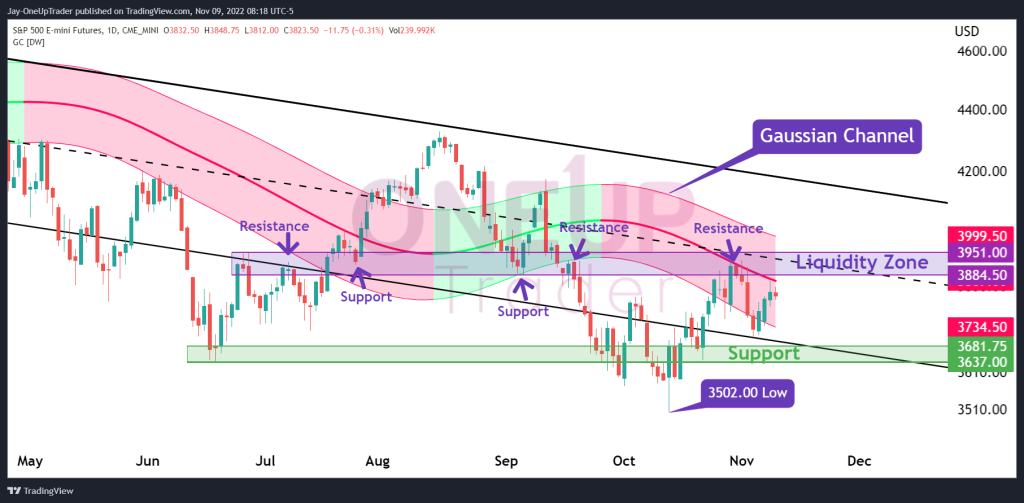
- ES price retraces into a liquidity zone at the same price as the Gaussian midline.
- Core inflation (CPI) and year-over-year inflation reports will be released tomorrow.
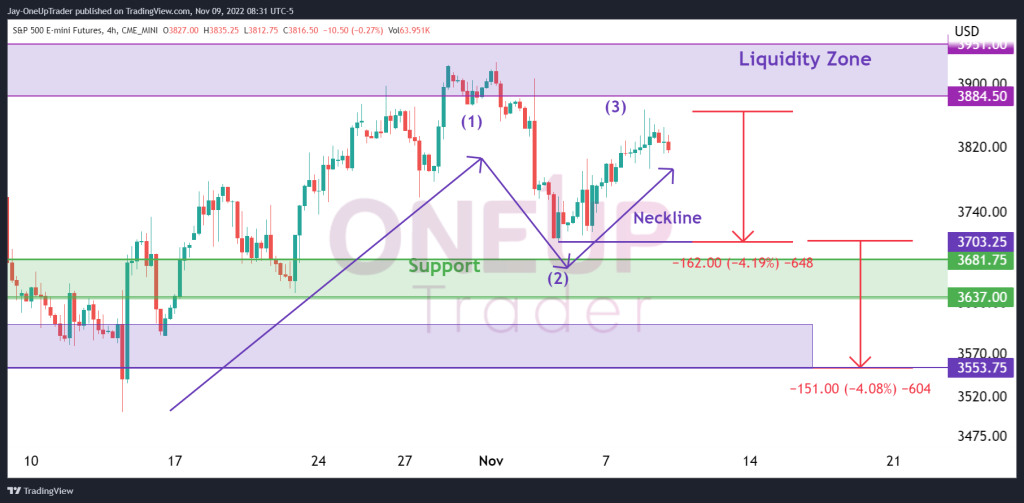
- A potential short-term 1-2-3 bearish pattern formation on the hourly chart.
Daily Chart Analysis
Looking at the daily chart, there are a few developments we can note. Toward the end of last month, ES rallied from a low of $3,502.00, the most recent low of the year, toward the liquidity zone marked in the chart below. The liquidity price zone is between $3,884.50 & $3,951.00. Price also touched the Gaussian midline when it retraced into the zone.
Moving Forward This Week
Tomorrow marks a big day as the core inflation rate report comes out with a forecast of 6.5% and the YoY inflation report with a forecast of 8%. The news will be released at 07:30 AM Central Time (CT).
The Daily technicals show us two main aspects to keep an eye on. The support zone above the yearly lows between $3,637 & $3,681.75 could be an area of liquidity where traders may begin to bid the market. The bull case is tentative in the medium term as we have already seen price find resistance in the liquidity zone mentioned above.
Another rally into that zone could see more selling than normal, and it will just be a waiting game to see whether the Bears or the Bulls are strongest. Of course, this is all very dependent on the inflation reports tomorrow.
Potential 1-2-3 reversal pattern on the hourly chart
The potential for a 1-2-3 reversal is there for the traders that want to see it. If you look at the chart below, the price has already formed all three points. For the pattern to be confirmed, all that is required is for the price to continue to fall below the neckline at $3,703.25. This could lead to targets of $3,553.75 which would be tantalizingly close to the year’s lows.