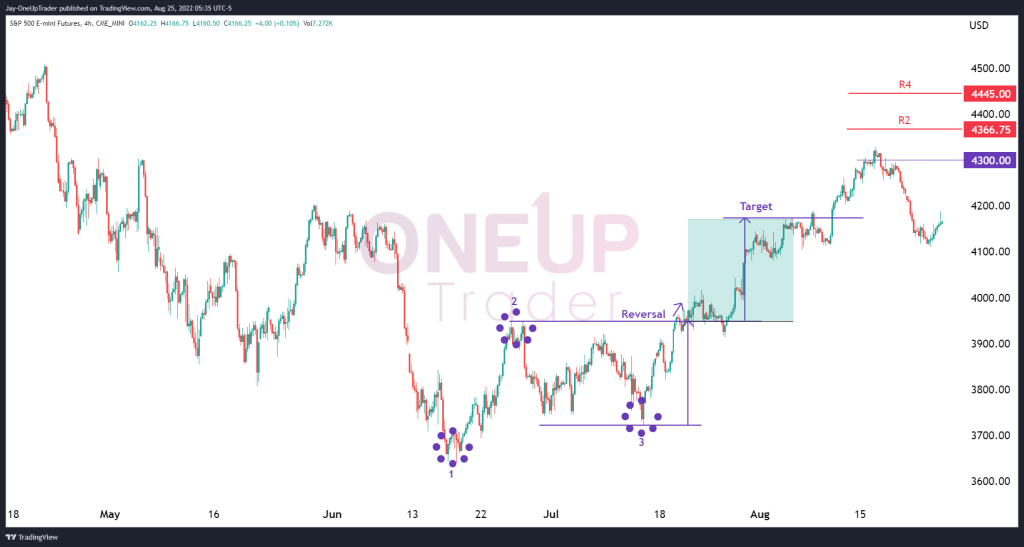
- 1-2-3 Reversal target hit
- A minor pullback on longer time frames expected
- Market Sentiment remains bullish
1-2-3 Reversal On 4-Hour Chart
A very high probability chart pattern known as the 1-2-3 reversal was formed on the 4-hour time frame of the E-mini S&P 500 (ES). The first point was formed on June 17th, the second point, which is the retracement (after a down-trend in this case) on June 27th, then the third point (an attempt to make a new low) on July 14.
At the second point, we draw a horizontal line indicating resistance. Once the third point has been formed on the chart, the market rallies, and if we notice a break above the second point’s resistance line, it’s a signal to look for a long trade, with a minimum target being the distance between the second and third points.
With the pattern already complete and the target hit, it is not uncommon for a consolidation period to develop. We see ES has retraced from its recent highs, but our outlook remains bullish while we look cautiously for targets of $4,300, $4,366.75, and $4,445, which are resistance levels on our pivot points indicator.
Interesting Find On Monthly Chart
Since 2010 the S&P 500 has retraced between 15% to 24%, four of its five retracements, with the only exception being the worldwide lockdowns dip. Every time this percentage drop occurred, the market rebounded to make new all-time highs.
In recent times, ES has just retraced 24.3%, and if history repeats, it would suggest the low could be in. However, times are very different now, and we must be cautiously optimistic that markets could continue rallying from here.
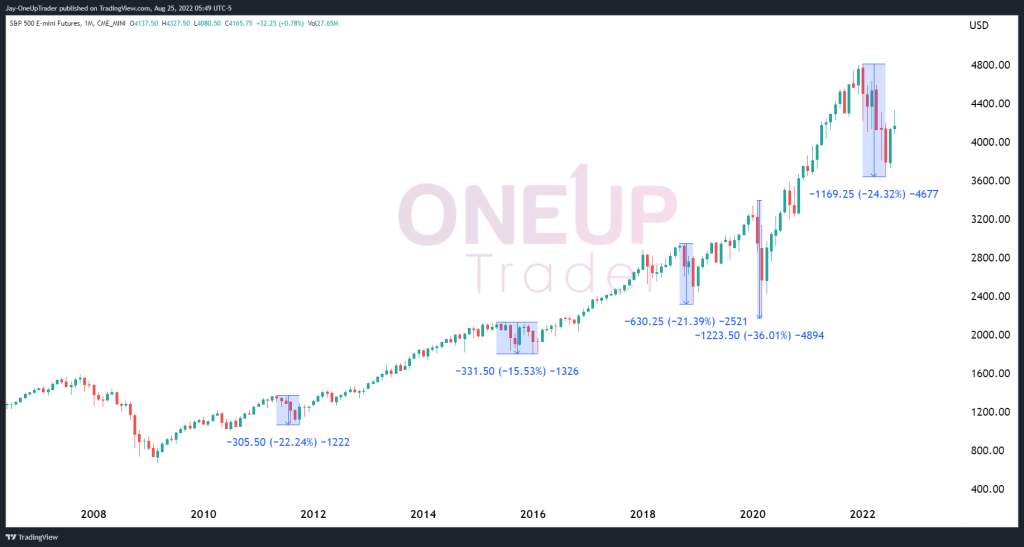
The Fed has been printing excessive amounts of free money for a long time, and sooner or later, the market may feel the negative side of that. Bears, be cautious, Bulls, be more cautious!