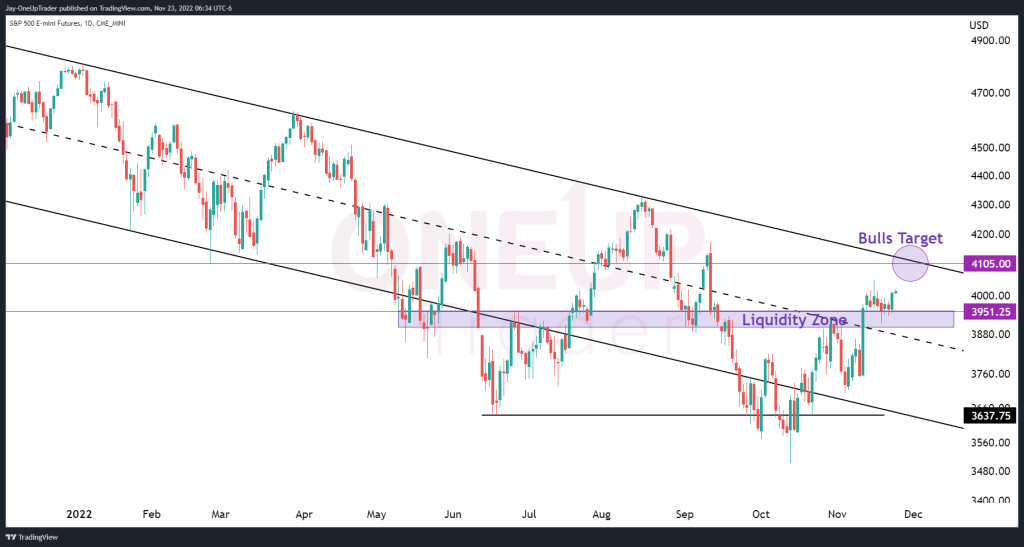
- Bulls may be targeting the top of the medium-term downward channel.
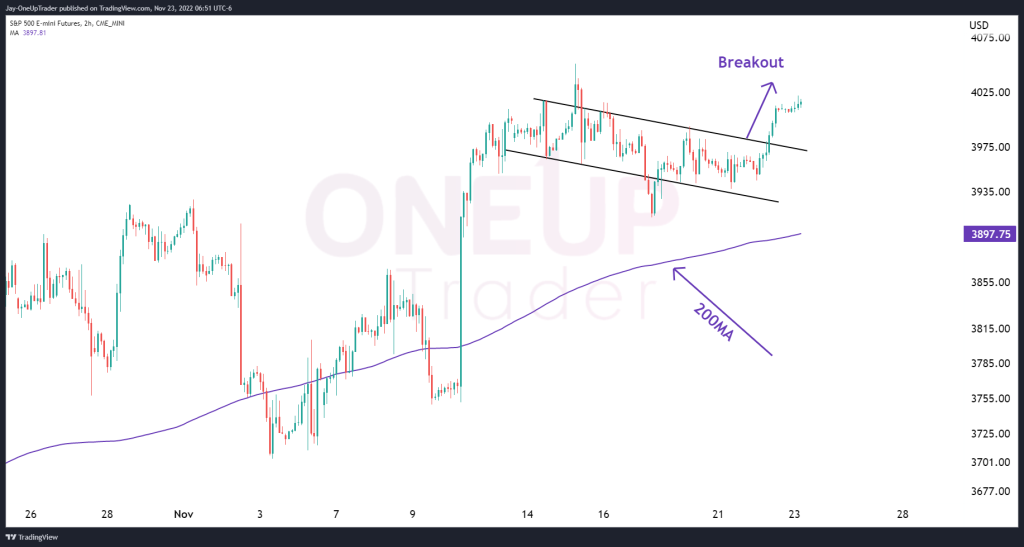
- A look into the consolidation zone ES has been trading within.
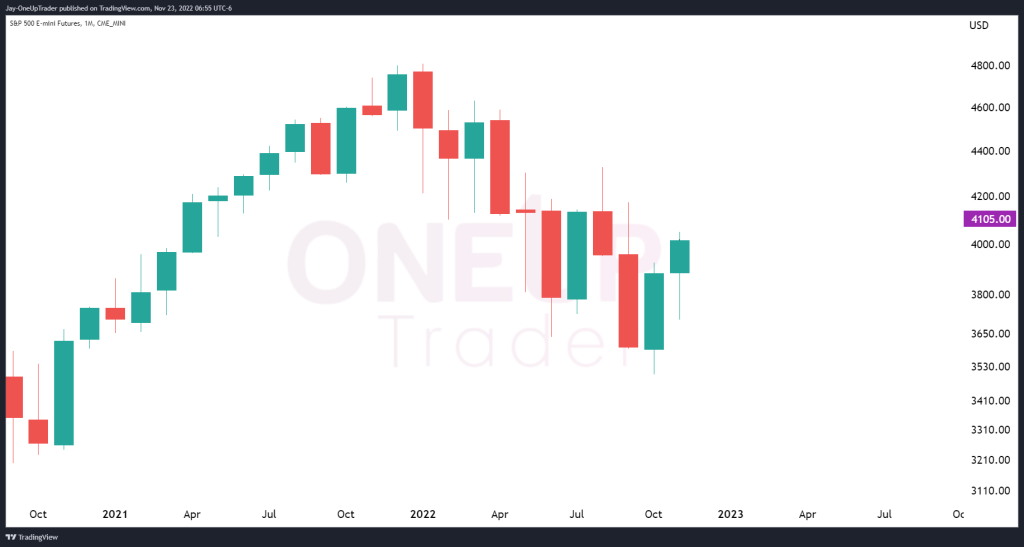
- Bullish candlestick formations on the monthly chart.
Price Rallies Through Liquidity Zone
We have seen higher prices in most equity markets since the CPI release came in lower than expected on November 10th. ES has rallied through the liquidity zone at $3,951.25, occasionally finding support when the price dipped into the zone. We will look at the consolidation zone that ES has traded within shortly as Bulls could be targeting the $4,105.00 level, which is the top of the downward trend channel.
Breaking Out Of the Consolidation Zone
Whenever there is an extended consolidation, the breakout that follows is usually very powerful because the sideways action before the breakout acts as a spring. We see this happening on the 2-hour chart, as the price moved sideways for a few days. This adds further fuel to the Bull case mentioned above.
The Monthly Chart
We have just 7 days until the ES monthly candle closes. An interesting possibility is on the horizon as November’s candle seems to be preping up to close in the green. If it does, it will be the first back-to-back monthly green candle since August of last year. A hawkish report from the FED in December then could mean the low is in for equity markets; however, it’s all FED-dependent.