- Inverted hammer is the main technical pattern driving price action.
- RSI has crossed the 50 line, indicating bullish momentum.
- There is little evidence for a bearish case.
Technical analysis
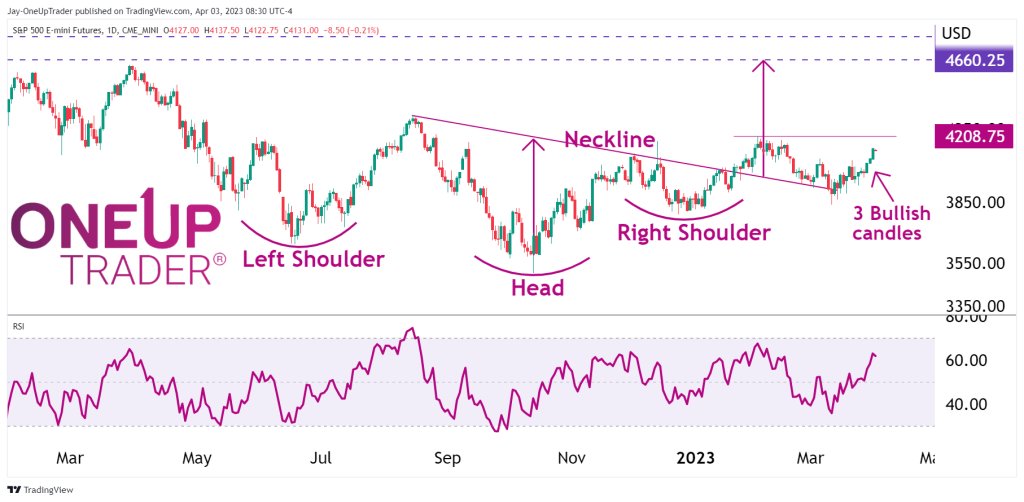
E-mini S&P 500 (ES) futures have been reacting in a bullish manner to a large inverted head and shoulders pattern, with bulls now targeting completion of the pattern with targets set at $4660.25. Price has tested the neckline multiple times and acted as a strong support which ES has finally springboarded off of.
The Relative Strength Index (RSI) has crossed the 50 line, indicating bullish momentum that is likely to continue. Additionally, ES has had three strong green candles in a row, indicating a strong bullish trend.
However, $4208.75 is a resistance level that may pose some challenge to the bullish trend. If ES can rally to $4660.25, it will only be a few percentage points away from the all-time high of $4808.25.
Overall, there is very little evidence for a bearish case, and traders should consider ignoring short trades on their systems while the inverse head and shoulders pattern on the daily chart continues to drive price action upward.