RTY has refused to break out of its almost two year consolidation even as the bigger indices continue to make new highs. RTY has seriously lagged, is it time for it to catch up and finally break out of the consolidation zone or are we headed right back down?
Weekly Chart
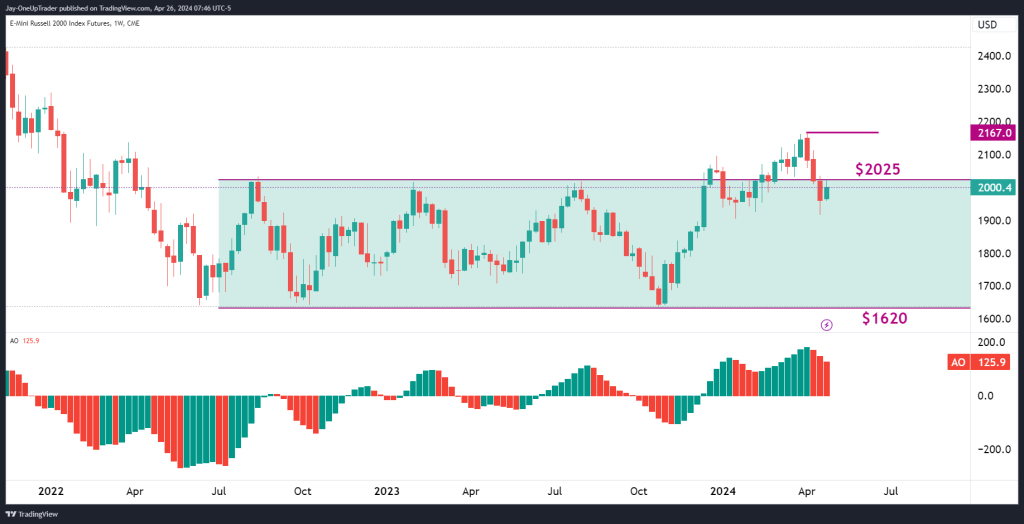
Bulls need to see price push through the minor resistance at $2167. This is a level that needs to be broken if a new bull trend can become a reality. At the moment, price is still stuck under $2100.
Bears will be targeting the support zone at $1620 which is the low end of the range mentioned earlier.
Daily Chart
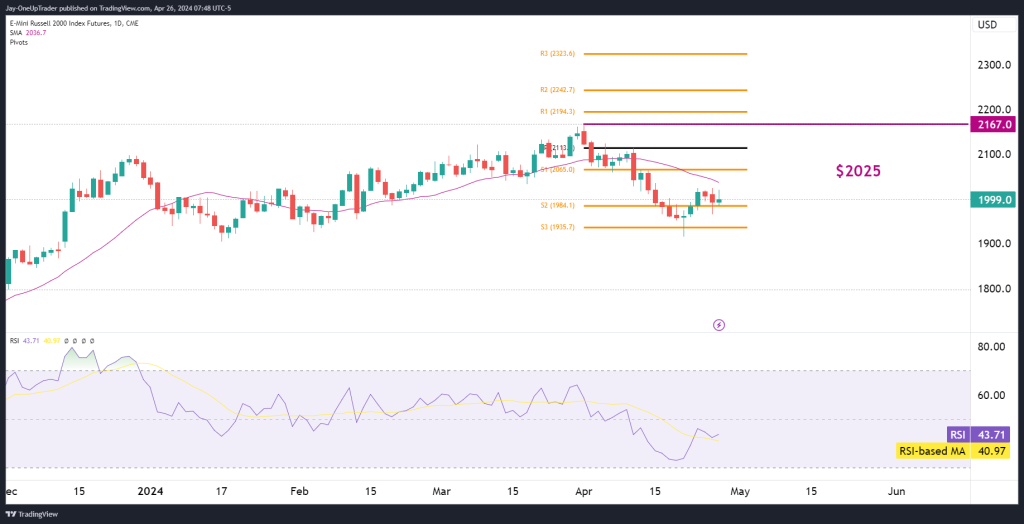
Price is trading below the 21-day moving average and the RSI has crossed below the 50 level. The 23 support on the pivot point indicator is holding strong with the formation of a powerful-looking morning star pattern. If price goes back down to test that level ($1935.7) and the support manages to hold, then bulls have hope of a possible move higher from there.