- The inverse head and shoulders are showing strong bullish momentum.
- A potential trade idea points toward a high risk-reward ratio.
- Remaining patient and disciplined through a trade like this.
Quick recap
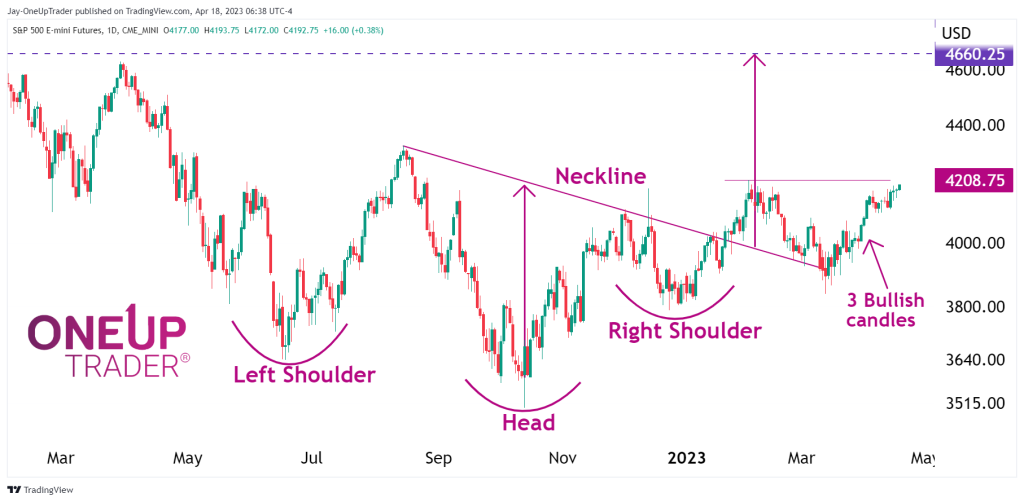
We have followed the inverse head & shoulders in ES for some time now, and finally, we are approaching a strong bullish breakout. This gives us a few trade opportunities as long as we maintain strict risk management rules.
The chart is bullish, I don’t see any play for the bears at the moment. The probabilities point toward a bullish break above $4,208.75 could lead to a move up toward $4,660.25. This is the target for the head and shoulders.
Trade Idea
With the conclusion that probabilities lay in favor of the bulls, we can begin initiating long positions at current prices with the target in mind mentioned above. If price falls below $4,111, the initial bullish break may have failed, but that does not mean we have turned bearish.
Remember to keep risk management rules in place and maintain discipline. Be patient, as this long trade may take weeks to play out fully.