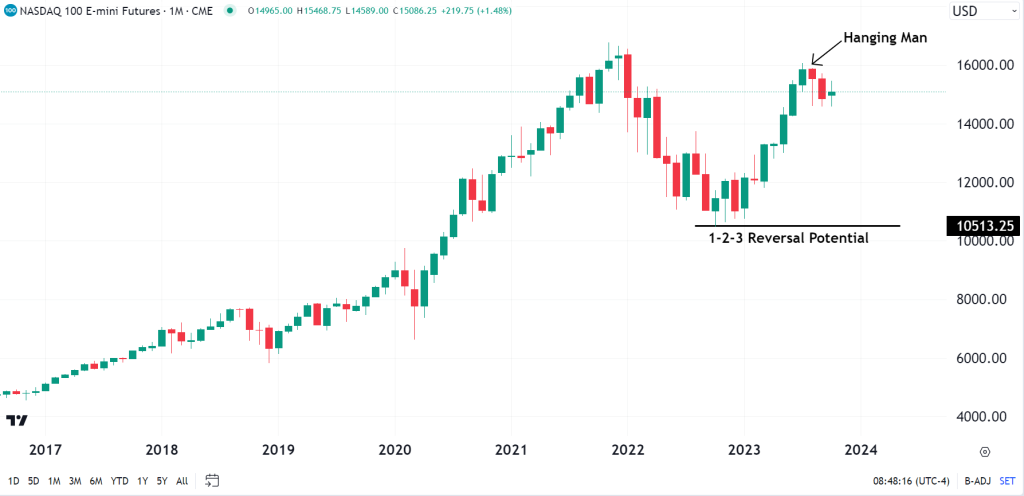
Monthly chart
The monthly chart is the most interesting to look at out of all the time frames because of the possibility of an enormous 1-2-3 reversal pattern that could send NQ tumbling to $6000. This seems unlikely at the moment but is still a possibility if price reverses from here and falls below $10513.25. The past two months have been red candles but overall, NQ is up over 34% for the year. The hanging man candlestick for August is a potential short-term top, so bulls need to see price break above that, or prices could be moving sideways or down for some time. NQ may also be stuck in a range between $10513 and $16000, but this will mainly come down to macroeconomic factors and the Feds movements.
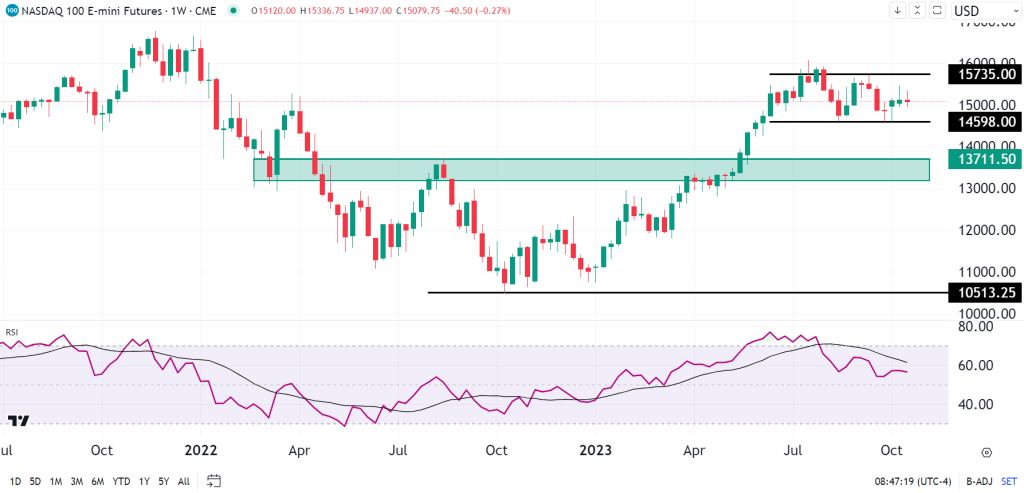
Weekly Chart
The RSI on the weekly chart was overbought for 9 weeks before finally pulling back slightly. There are mixed signals with wicks on both sides, but short-term key levels to watch are 14598 and 15753. If the upper level is broken, it is likely to return to the bullish trend it previously was in. If the lower level is breached, the next support level is 13711.50.
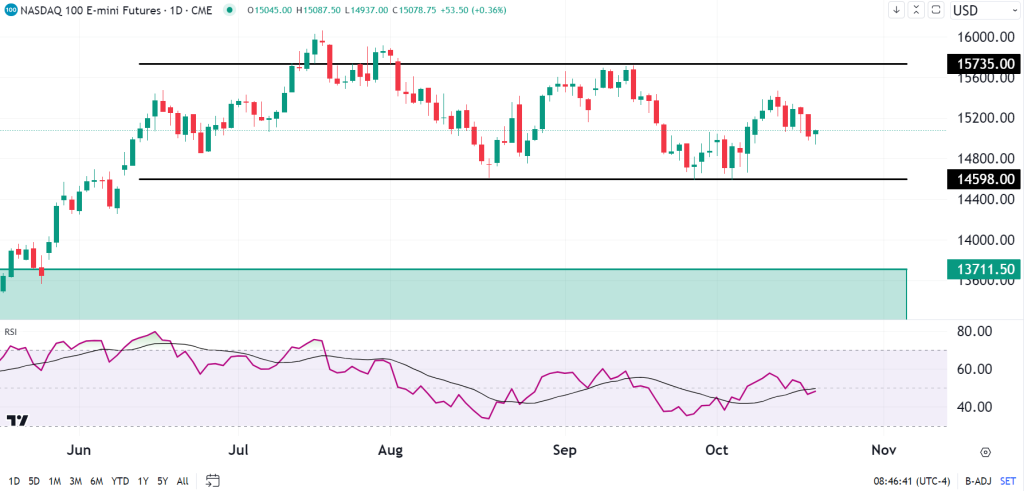
Daily Chart
Zooming in on the levels above, we can see that NQ has been stuck in that range essentially since June. This is to be expected because profit-taking is taking place after such a strong bullish rally at the start of the year. It is a bullish sign, too, so bulls might find it fruitful to buy any dips awaiting a bullish break. As long as price remains above $14598 they will still have sentiment on their side.
Traders, please remember to keep strict money management rules in place and always be disciplined.