

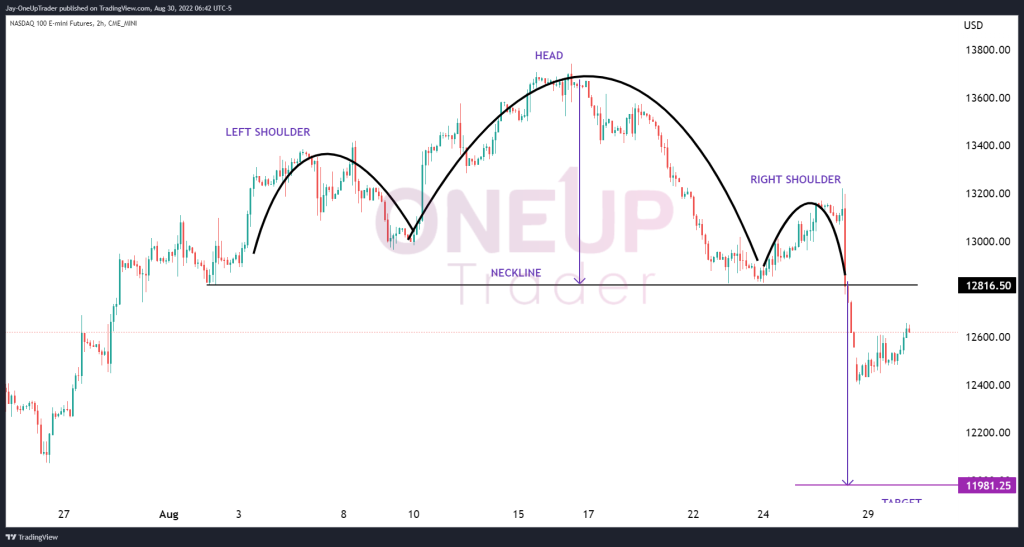
- Head and Shoulders pattern on the 2H time frame
- The bear flag pattern is still in play
- Bullish morning star pattern on daily
As a continuation of our analysis on NQ yesterday, Monday’s session gave us no signal that bearish sentiment is reversing. In fact, looking at the 2-Hour time frame, a Head and Shoulders pattern has broken its neckline with targets of around $11,900, just like our bear flag on the hourly.
We found it necessary to post two technical analysis sessions on NQ primarily because of what is happening on the daily chart. In yesterday’s session, there was a morning star candle stick pattern that formed. The Asian and Europen sessions have rallied, breaking above yesterday’s high.
A potential bull case is forming, and this is it: If the market continues to rally during the US session and closes above yesterday’s high, traders could take that opportunity to initiate new longs, with stop losses below the morning star pattern. However, targets would be undefined at this stage because of the lack of concrete reversal evidence.
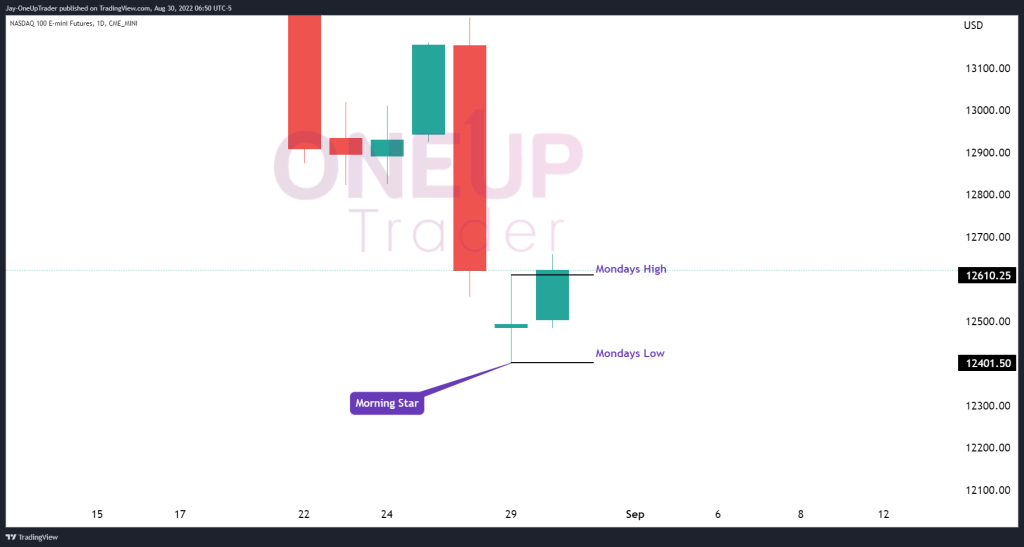
The Bear case remains strong for NQ at the start of Tuesday’s session. The formation of a morning star at the end of yesterday’s session, however, gives some hope to bulls that a short-term reversal could be possible. Remaining conservative, Tuesday’s session will need to close above Monday’s high of $12610.25 for any bullish sentiment to hold water in the short term.
The Head and Shoulders pattern on the two hourly and the bearish flag on the hourly tells us the downside has a higher probability of playing out than the opposite.

