- Trend Channel retested after Initial Breakout
- 50% Fib Level holding support
- Potential Flag formation on the hourly chart
Long Term Outlook
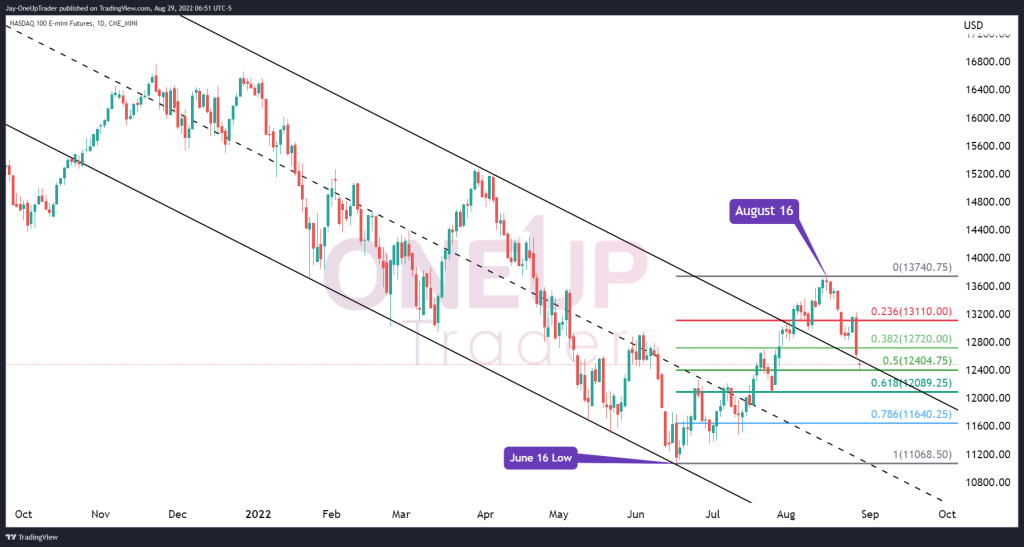
As we know from the previous analysis done on August 22nd, NQ was in a strong upward channel but broke to the downside. The downward move accelerated on Friday, falling over 4% and then gapping down at the start of the Asian session this morning. Measuring a Fibonacci retracement from the July 16 low to August 16, the 50% level is at $12,400. As prices tested that level, they immediately bounced, finding some strong bids at that level. This is also around the upper side of the trend channel.
Our Bearish case is that prices fail to find a floor but would need to drop further and close below the 50% Fib level; this would give us targets at the 61% level ($12,089.25).
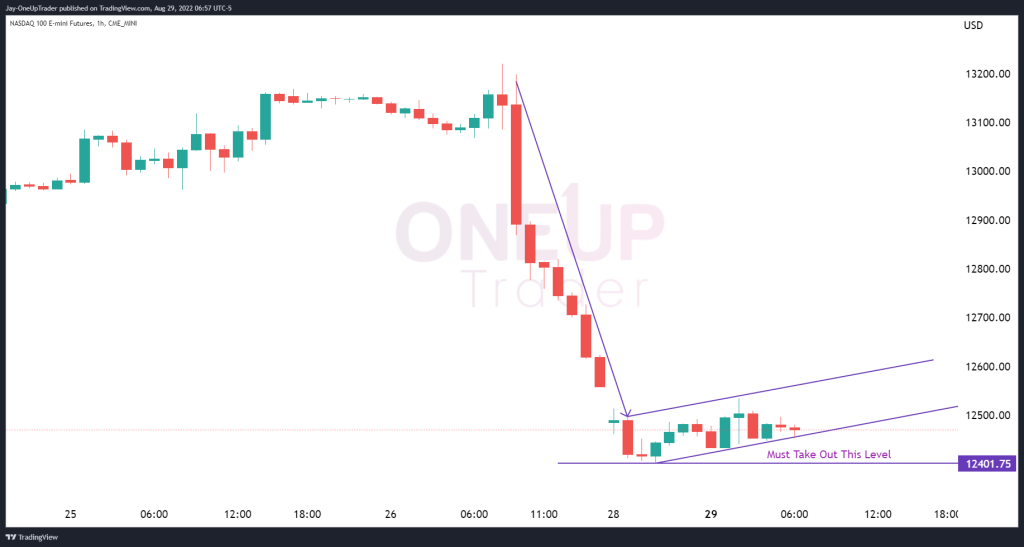
Potential Flag pattern On Hourly
The hourly chart is in the process of forming a flag pattern. Since the selling momentum was so strong on Friday, it is a reasonable assumption that the actual flag (consolidation period) could be a lengthy one. If the pattern is going to play out, we need to see prices break out and close below the $12,401.75 low. Measuring the pole gives us a target of around $11,800, but as mentioned, we must see a break below the most recent low for this pattern to be confirmed.
Many are familiar with the reliability of a flag pattern, but for the traders who are not, you can find our video describing how to trade the pattern here.