

Weekly Chart
Breakout Confirmation
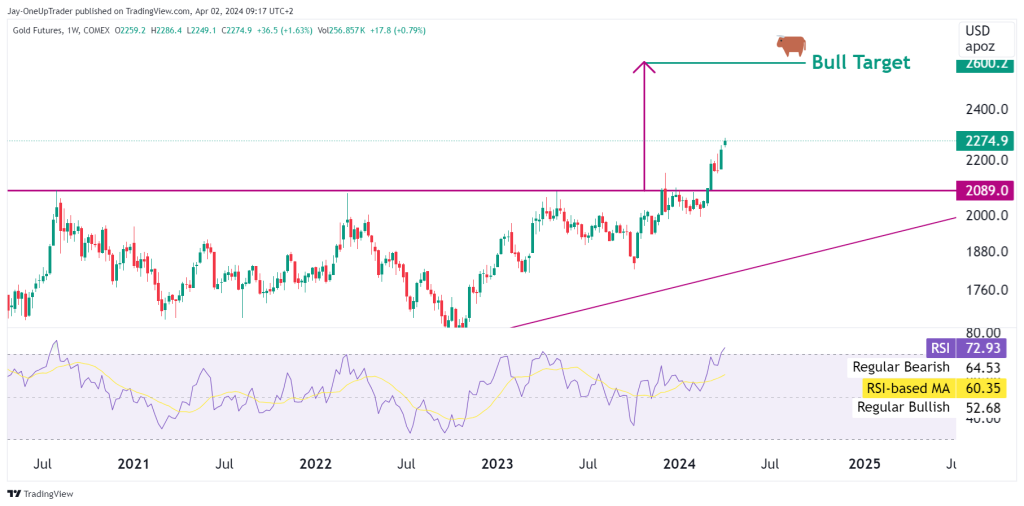
The breach of the previous ATH a few weeks ago remains as the most significant event on the Gold chart this year. With that level now acting as resistance near $2089, we could wait for a pullback to take a long position because at current levels, we would be chasing the market if we buy now.
Bull Target On Weekly
We have an ambitious bull target set at $2600. This target comes from the measured move of the previous consolidation pattern which was an ascending triangle. To learn more about triangles, see our full guide here.
Daily Chart

Trade Strategy:
- Long Opportunity: Consider long entries on pullbacks to support levels, especially near $2089, with stop-losses set below the breakout level or the 200-day SMA, depending on your risk tolerance.
- Profit Targets: Set incremental profit targets leading up to the $2600 bull target, taking partial profits as each target is reached to lock in gains unless you have a long-term view on Gold and don’t mind holding for a while.
- Risk Management: Monitor the RSI and MACD for signs of divergence, which could indicate weakening momentum and lead to a possible consolidation phase or pullback.
Remember to keep an eye on broader market trends and economic factors that influence gold prices, such as inflation data, currency movements, and geopolitical events. As with any trading opportunity, ensure it fits within your overall trading strategy and risk parameters.
