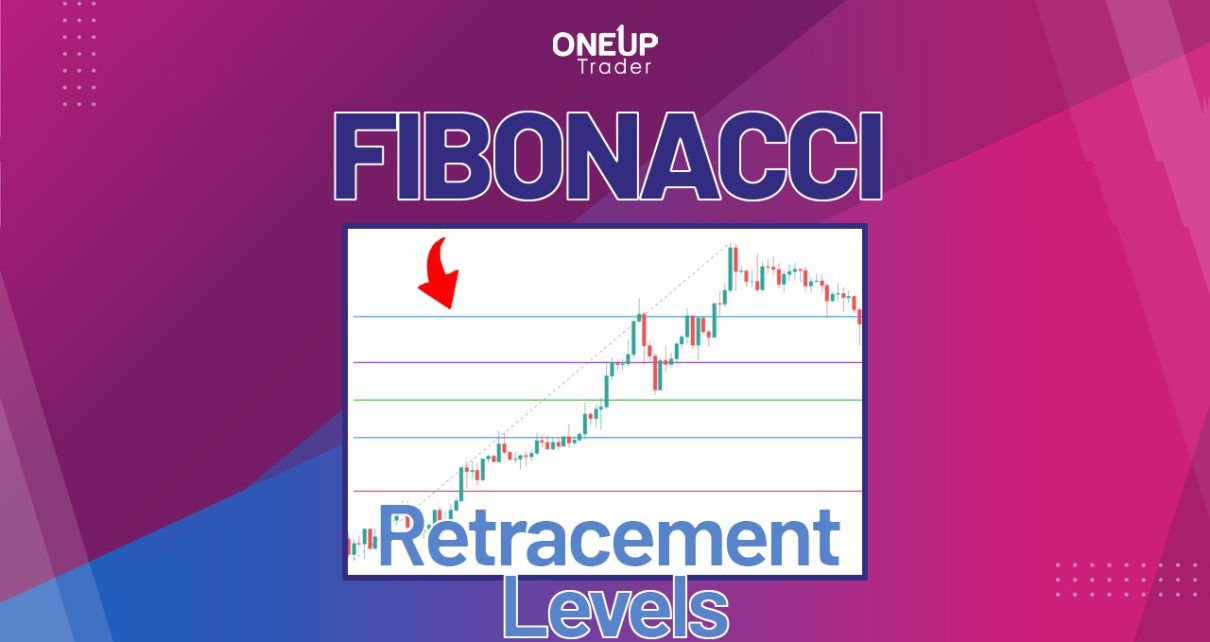
Moving average convergence divergence (MACD) is one of the most versatile technical indicators – it’s both a trend and momentum indicator. The MACD indicator can best be described as a 2-in-1 indicator; it shows the start of a bullish or bearish trend using the MACD crossover and the strength or weakness of a trend with Read More…
Trading Tips
Rising and Falling Wedge Chart Pattern Trading
Any price action has a series of steady bullish and bearish trends punctuated by momentary price consolidation. When timed accurately, breakout trading strategies can be invaluable for catching trends while they’re just beginning. And this is what the rising and falling wedge chart pattern trading is geared towards. What are Wedge Chart Patterns? A wedge Read More…
Head and Shoulders Chart Pattern Trading
Technical indicators have always been faulted for lagging, making price action analysis invaluable to any trader. With hundreds of chart patterns to choose from, it may not be easy to decide which one is more reliable and suited to your trading style. However, it’s a general consensus that the ideal ones should generally be easy Read More…
Double Top and Bottom Chart Patterns in Trading
In technical analysis, double top and bottom are chart patterns that predict market trends. Hence, it is not uncommon to find double tops and bottoms on the charts of financial instruments. Double tops signify the end of a bullish trend, whereas double bottoms indicate a possible bearish trend reversal. Chart patterns such as double tops Read More…
Following the S&P500 Trend in 2022
Equity markets are known to be trending in nature over the years. With capital flows, investments, and economic expansion, developed world equity markets tend to go up by time thus compensating investors for the risk they are taking and the liquidity they are providing. This article will discuss a technical tool used to determine and follow the trend by showing showing an example on the S&P500 index.
Using VIX Indicator to Buy Market Dips
Volatility is an important part of trading. It is related to risk but also in some cases, opportunity. This article will show how to use volatility to get a directional bias in the equity futures market. Volatility analysis is both quantitative and psychological in nature because it uses complex calculations to understand the level of fear and greed in the market.


