The S&P500 trend in 2022 is why equity markets are known to be trending in nature over the years. With capital flows, investments, and economic expansion, developed world equity markets tend to go up by time thus compensating investors for the risk they are taking and the liquidity they are providing. This article will discuss a technical tool used to determine and follow the trend by showing an example on the S&P500.
The S&P500 Trend
When we say that the global state of the stock market of a country is healthy, we are referring to a weighted calculation of the market prices of a basket of selected stocks that have an impact on the local economy. When these impactful stocks go up in value, it can generally be seen as a proxy that the global stock market is going up due to correlation. These weighted calculations are referred to as equity indices. We will discuss the US equity index, the S&P500, a basket of 500 US companies.
Naturally, to invest in the US stock market, we will not really invest in these 500 companies individually. There are investment vehicles such as ETFs and futures contracts that offer the opportunity to track and follow the values and the returns during the S&P500 trend.
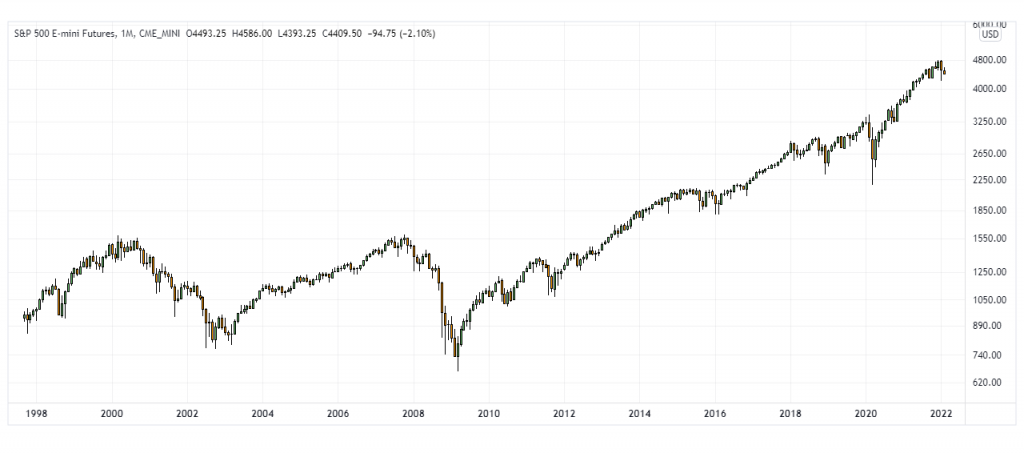
The E-mini S&P500 futures continuous contract is used to show the S&P500 index values and it is a good proxy as it is tradeable as futures contract. Take a look at the below graph showing the E-mini values.
Now, let us see how to develop a system that allows us to have trading signals and to understand where the market is likely headed over the course of the next weeks and months. For this, we will have a look at the parabolic stop-and-reverse technical indicator.
The Parabolic Stop-And-Reverse as a Trend Indicator
The parabolic stop-and-reverse is an interesting indicator created by Welles Wilder Jr. who is also the creator of the famous relative strength index. The parabolic stop-and-reverse was originally designed as a trailing stop in order to give levels which invalidate the current trend following trade.
The indicator appears as a series of dots along the market price which alternate between being above and below it. We must keep this information in our heads for the moment. It is worth noting that it performs relatively well in steady trends but just as any other indicator, it has its weakness, in this case, ranging markets.
Using the Parabolic Stop-And-Reverse to Follow the S&P500 Trend
The basic understanding is that when the parabolic stop-and-reverse (the dots around the market price) is under the current price, then the outlook is bullish and when it is above the current price, then the outlook is bearish. This also means that crossovers are trading signals. Take a look at the below chart.
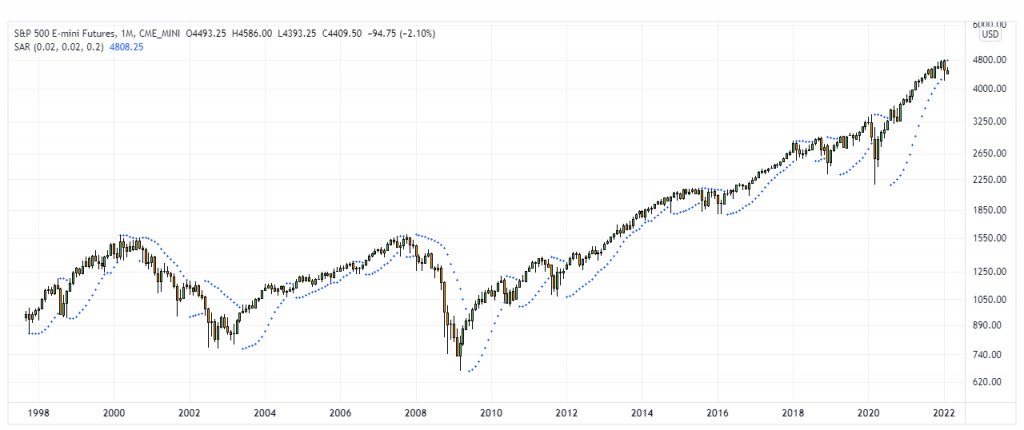
We can see that the parabolic stop-and-reverse is following the trend and tries to predict the start of the new one. Surely, in every indicator, there will be false signals but generally with trending markets, the signals provided by the parabolic stop-and-reverse are reliable over the long-term. The below is an example of how we can use the indicator:
- The outlook becomes bullish when the dots switch from above the market price to under it.
- The outlook becomes bearish when the dots switch from below the market price to above it.
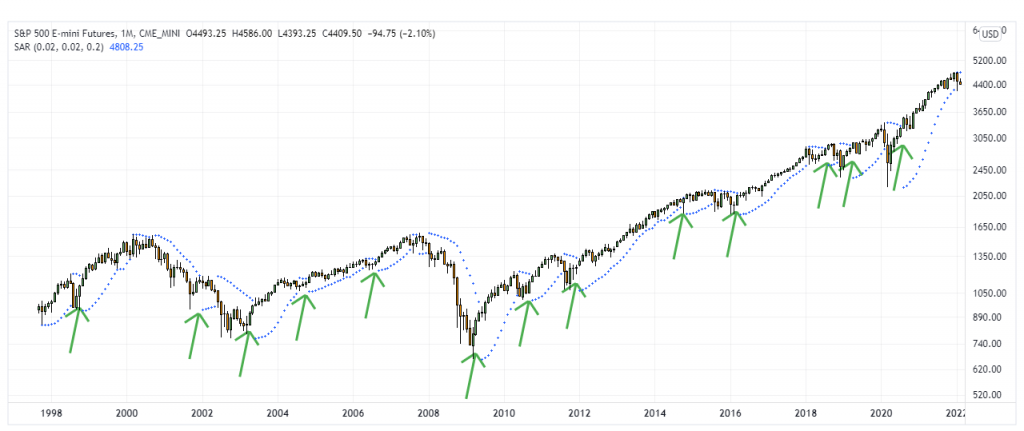
The above graph shows the bullish signals generated after the parabolic stop-and-reverse switches from above the market to under it. Now, why did we take only the buy signals even though we can short the futures market? The answer lies with a famous quote by Martin Zweig.
“The trend is your friend”
The quote above states that it is best finding buy signals in a bullish market rather than in a bearish market so that we maximize our chances of a winning trade or investment. Therefore, by using only long-term buy signals on the parabolic stop-and-reverse, we may be able to detect interesting dip buying opportunities during the S&P500 trend. This goes the same for other equity index futures.
To Summarize
We have seen that equity investing and trading may benefit from improved timing through a technical indicator called the parabolic stop-and-reverse. The strategy can be tweaked to every market and results may be optimized. It is up to the trader to put his or her preferences.