

Moving averages (MAs) are among the most popular technical trading indicators. Their popularity majorly stems from their simplicity and versatility – they are easy to calculate and use; can be used to show both a price action’s trend and strength. Thanks to their popularity, several variations of the moving average exist. This guide will discuss how you can trade with the exponential moving average (EMA).
What is the EMA Indicator?
The exponential moving average (EMA) indicator is a variant of the moving average weighted towards assigning higher significance to the latest price points. That’s why it’s sometimes called the exponential weighted moving average (EWMA). This means that the EMA is more sensitive to price changes and can be used to capture emerging trends more quickly.
Exponential Moving Average Vs. Simple Moving Average
The EMA and the SMA are the most commonly used types of moving averages, and similar trading strategies can be used with either of them. The difference between these two is in how they are calculated. As we’ve mentioned, the EMA assigns a significantly higher weight to the most recent price points.
On the other hand, the SMA assigns an equal weighting to all price points within the selected period. It simply averages the price within the period. The SMA is calculated by summing up the prices within a given range and then dividing by the number of periods within that range.
Exponential Moving Average Calculator
When calculating the EMA, the formula can be applied to:
- The highest price attained
- The lowest price in each period
- The opening price of each period
- The closing price of each period
- The average of the highest and the lowest in each period
- The average of the open, highest, lowest, and closing price in each period
- The average of the highest, lowest, and closing price in each period
Typically, all trading platforms will automatically compute the EMA for you, all you have to do is select the preferred price and the period. But if you intend on calculating the EMA yourself, here’s the EMA formula.
EMA [today] = (Price [today] x K) + (1 – K)EMA [yesterday]
Where:
K is the EMA’s weighting factor
K = 2 ÷ (N + 1)
N = the length of the EMA
Price [today] = the current closing price
EMA [yesterday] = the previous EMA value
EMA [today] = the current EMA value
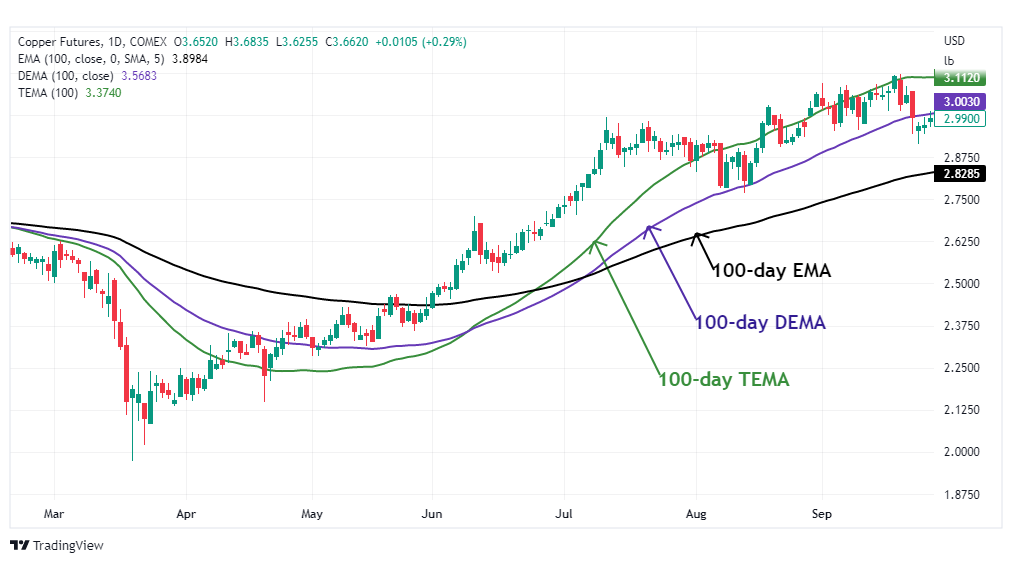
Admittedly EMAs can be notoriously laggy, increasing the probability of fakeouts. But this lagging can be significantly reduced by using expansive data sets. This is where the double exponential moving average (DEMA), the triple exponential moving average (TEMA), and the exponential weighted moving average (EWMA) come in.
The trading strategies when using DEMA, TEMA, and EWMA are the same. But as you can see from the chart below, DEMA is more responsive than the EMA, while TEMA is more responsive than the DEMA. While their trading strategies are similar, their optimal usage entirely depends on your trading strategy.
Double Exponential Moving Average (DEMA)
A double exponential moving average (DEMA) indicator is a variation of the regular EMA indicator. As we’ve mentioned, its primary goal is to reduce the lag experienced on the EMA. It achieves this by doubling the value of the EMA. Here’s how the DEMA indicator is calculated:
DEMA = (2 x EMA1) – EMA2
Where:
EMA1 = EMA of price
EMA2 = EMA of EMA1
Triple Exponential Moving Average
The TEMA indicator is also a variant of the regular EMA designed to reduce the lag. It gets its name from the fact that the EMA is tripled, not that three different EMAs are used. Here’s the formula for the TEMA indicator:
TEMA = (3 x EMA1) – (3 x EMA2) + (EMA2)
Where:
EMA1 = EMA of price
EMA2 = EMA of EMA1
EMA3= EMA of EMA2
How to Trade with the EMA
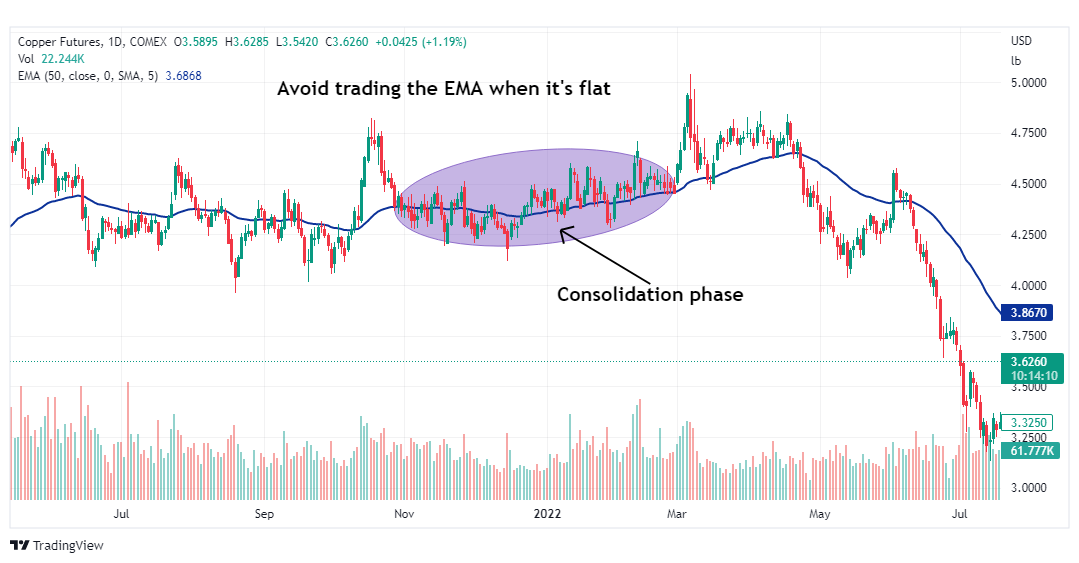
The EMA basically serves as dynamic support and resistance and only works best in a trending market. This means you should avoid using the EMA when the market is in a consolidation phase – when the EMA is flat.
Generally, there are two ways to trade with the EMA – breakout trading and crossover trading. A key point to note when trading the EMA or any of its variants is that they tend to be more effective over longer timeframes. That’s because time allows the “market noise” to be filtered out.
EMA Breakout Trading
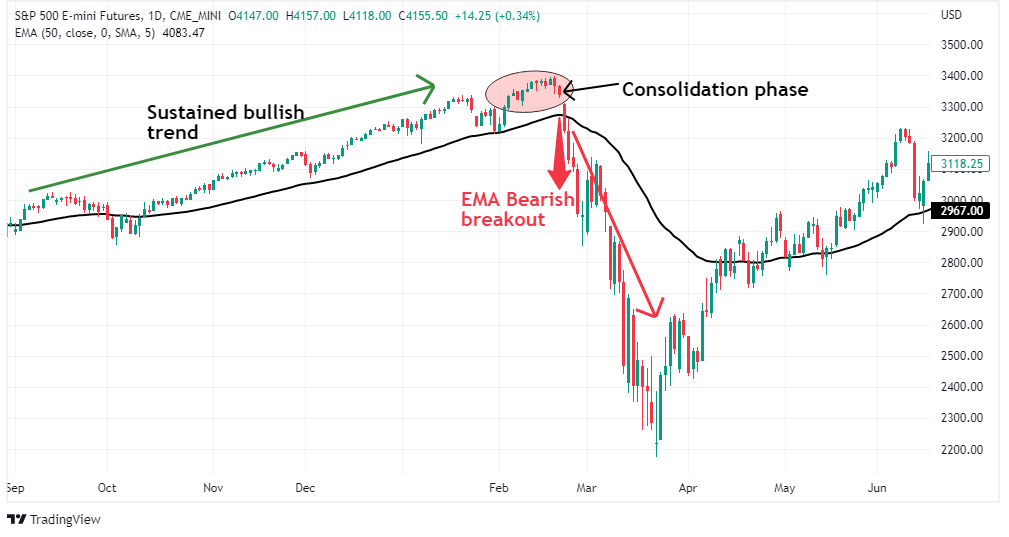
As we’ve mentioned, EMA serves as dynamic support and resistance, which means you can use the EMA for breakout trading. Ideally, the best timing for EMA trading is right after the market undergoes a consolidation phase, implying there’s a higher probability of a massive breakout.
EMA Bullish Breakout
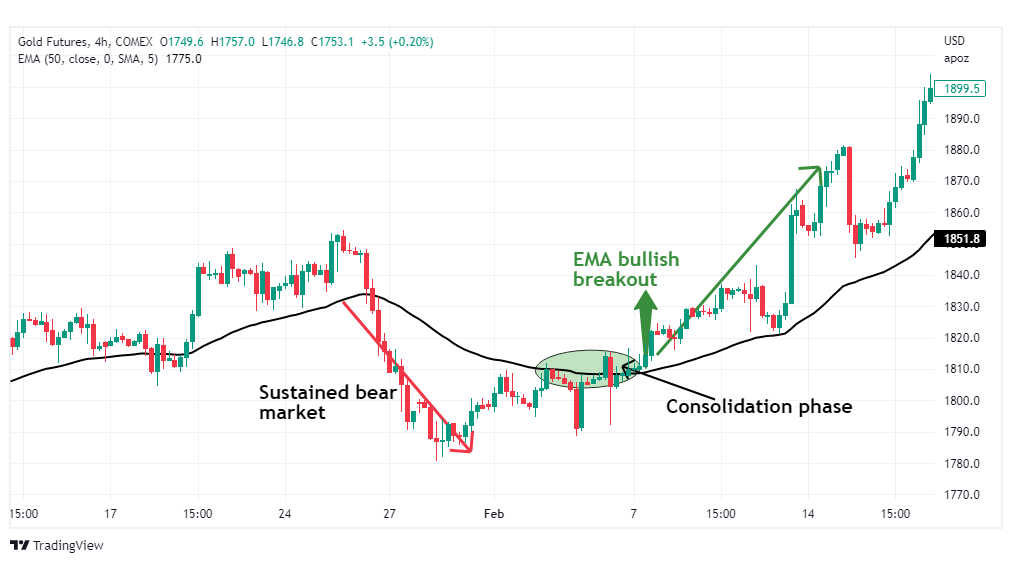
A bullish EMA breakout occurs when the price action breaks above the EMA. Ideally, the best breakouts usually occur after a period of consolidation. Bullish EMA trends are characterized by an upward sloping EMA, and the steeper the slope, the stronger the momentum.
A steep slope means that the recent prices are increasing at a faster rate, implying that the bullish trend is stronger. An ideal bullish breakout is one that follows a period of consolidation after a sustained bear market. And the best entry point is after the price breaks and closes above the EMA.
To avoid any false breakouts, always ensure that the candle crosses above the EMA, close above it, and the subsequent candle opens higher.
When trading with the EMA, setting your profit target should entirely be based on market volatility. You can use the average true range (ATR) indicator to determine the appropriate number of pips for your profit target. The ATR indicator simply measures the market volatility over a given period.
The stop loss target should be at the lowest of the candle immediately below the EMA.

EMA Bearish Breakout
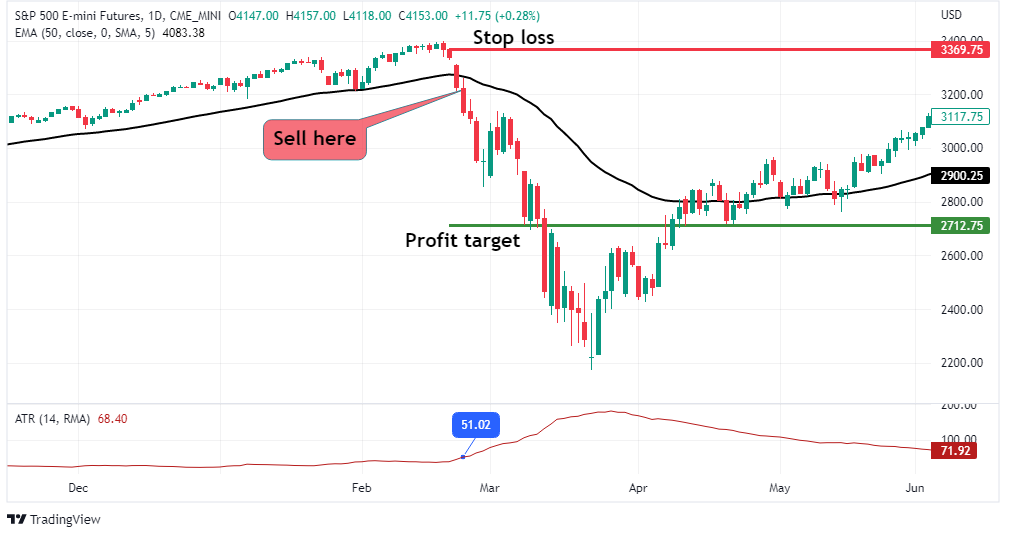
A bearish EMA breakout occurs when the price action drops below the EMA, usually after a period of consolidation following a bullish trend. Bearish EMA trends are characterized by a downward sloping EMA, and the steeper the slope, the higher magnitude. A steep slope means that the recent prices are dropping faster rate, implying a stronger bear market, making it the best setup to open a short position.
An ideal bearish breakout is one that follows a period of consolidation after a sustained bull market. And the best entry point is after the price breaks and closes below the EMA. In this case, we’ll use the 50-day EMA.
And to avoid any false breakouts, always ensure that the candle drops below the EMA, closes below it, and the subsequent candle opens lower.
You can use the ATR indicator to determine the optimal profit target depending on the prevailing market volatility. As for the stop loss, it should be just above the high of the candle immediately above the EMA.
EMA Crossover Trading
The probability of fakeouts tends to be higher when trading EMA breakouts. This is why EMA crossover trading can be convenient. In EMA crossover trading, two EMAs of different periods are used. There’s no specific rule as to which EMAs to use, so you can choose any depending on your trading style. For our case, we’ll use the 200-period and 50-period EMAs whose crossover forms the golden cross and the death cross. But you can always use them on lower timeframes.
In this case, the 50-period EMA measures the price action trend over the past 50 candles, while the 200-period EMA measures the price action of the preceding 200 candles. And since the EMA indicator assigns a higher weighting to recent price changes, the lower period EMA will be more responsive compared to the higher period EMA and thus detect trend changes faster. The logic in this strategy is that when both EMAs are trending in the same direction, the trend is stronger.
And keep in mind that you should only trade with EMA crossover in a trending market.
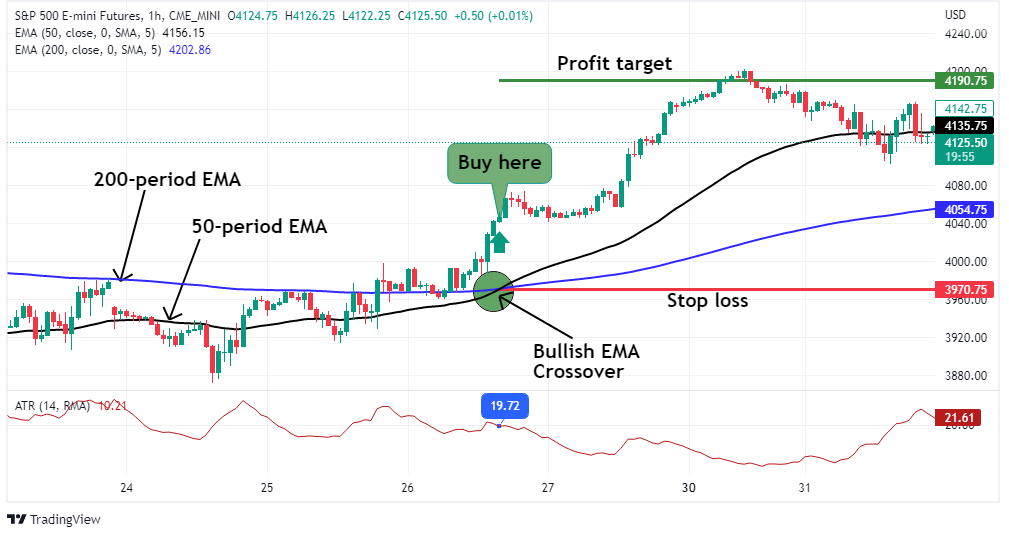
Bullish EMA Crossover
A bullish EMA crossover occurs when the lower period EMA crosses above the higher period EMA; in this case, when the 50-period EMA crosses above the 200-period EMA. This crossing is usually called the golden cross and signifies the beginning of a sustained bullish trend.
To avoid potential fakeouts do not open a long position immediately after the crossover. Always wait for the subsequent candle to open above the crossover candle. And provided both the 50-period EMA and the price action remain above the 200-period EMA, the bull market is considered largely intact.
When trading the EMA crossover, your profit target should be around 75% (three quarters) of the prevailing volatility as measured by the ATR. Your stop loss target should be below the longer period EMA (in this case the 200-day EMA).
The logic here is that short-term buyers exiting their positions might temporarily push the price below the shorter period EMA (in this case the 50-day EMA); but when the price drops below the longer period EMA, it means there is sustained selling pressure in the market. And if you’re risk averse, you should consider having a trailing SL around the 100-day EMA.
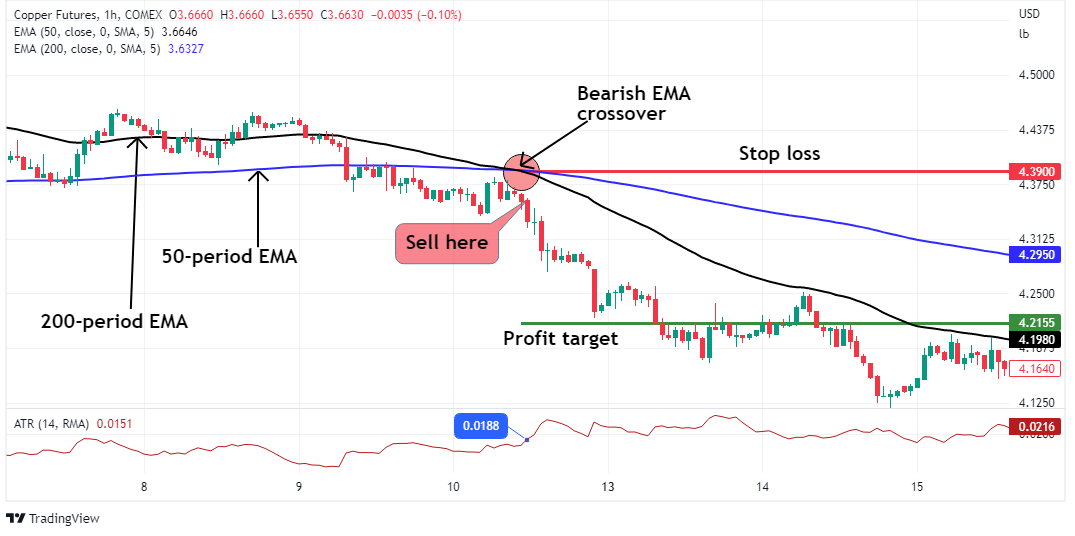
Bearish EMA Crossover
A bearish EMA crossover occurs when the lower period EMA drops below the higher period EMA; in this case, when the 50-period EMA crosses below the 200-period EMA. This crossing is usually called the death cross; it signifies the ending of a bullish trend and the start of a sustained bear trend.
When trading the bearish EMA crossover, always wait for the subsequent candle to open below the crossover candle before shorting the market. Generally, as long as the 50-period EMA and the price action remain below the 200-period EMA, the bear market is considered to be intact.
Your profit target should be based on the prevailing market volatility as measured by the ATR indicator, and the stop loss target above the longer period EMA. You may also consider attaching a trailing stop around the 100-period EMA.
Conclusion
The exponential moving average indicator is one of the simplest and most versatile technical indicators – it can be used to show both an asset’s trend and momentum. The EMA places more weight on recent price trends and is more responsive to trend changes. And as we’ve shown in this guide, this makes it ideal for breakout trading and crossover trading.