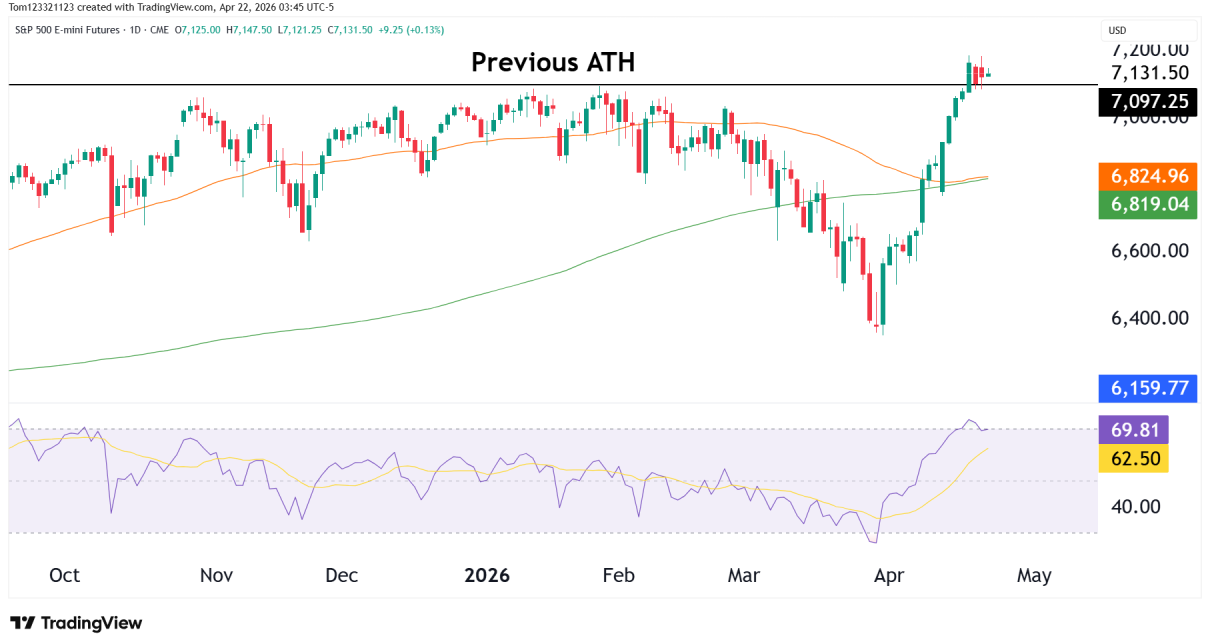
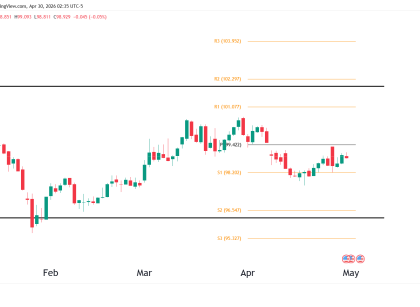
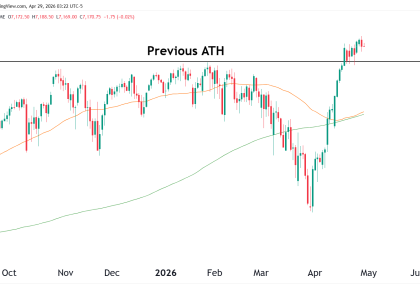
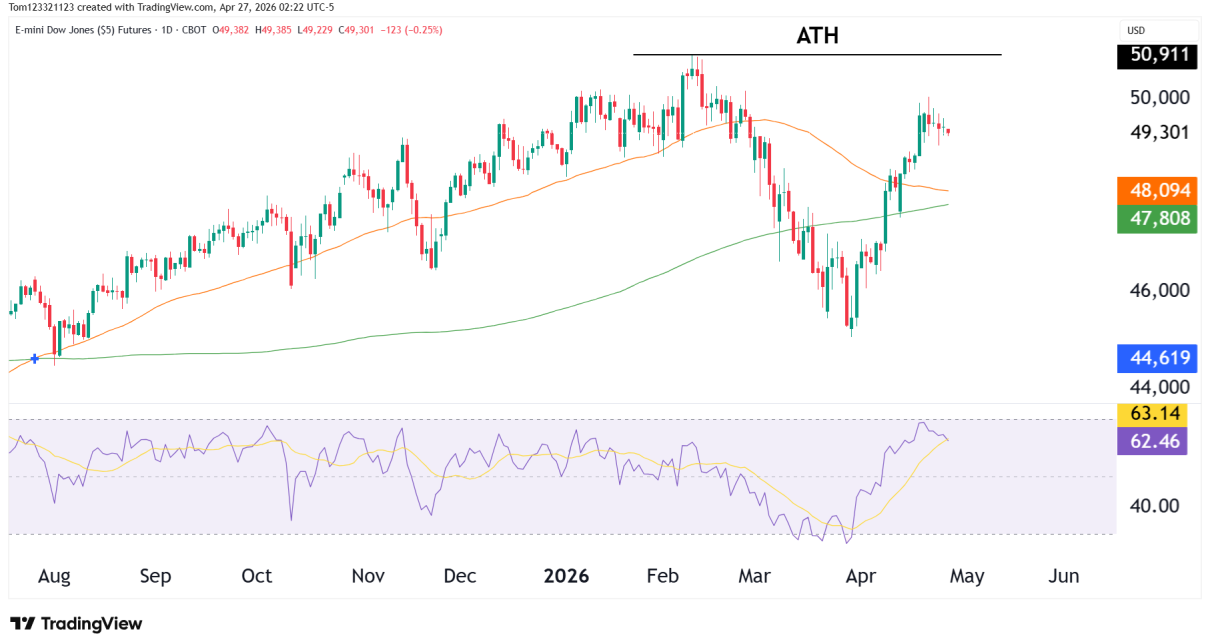
rty russell 2000
Technical Analysis

Russell 2000 (RTY) Technical Analysis, 24 February 2026

Introduction The E-mini Russell 2000 futures (RTY) continue to consolidate near recent highs after a strong rally that has lasted since April 2025. Unlike the S&P 500 and Nasdaq, which are pressing into more resistance, RTY is moving at a more gradual pace. Without the bigger indices like ES and NQ rallying, it is more Read More…

crude Oil futures
Technical Analysis

Crude Oil (CL) Technical Analysis, 23 February 2026

Introduction Crude Oil futures continue to rebound from the $55–56 support zone, with price now pressing into the mid-$60s. The bounce has been steady rather than explosive, but bullish action is clearly improving on both the daily and weekly timeframes. After months of lower highs, the bulls are attempting to find a way higher and Read More…

dxy
Technical Analysis

U.S. Dollar Index (DXY) Technical Analysis, 20 February 2026

Introduction The U.S. Dollar Index (DXY) is attempting to stabilize after another rejection from the 101.90–102.00 resistance zone. Price recently swept below 96.00 before quickly reclaiming support in the 96.00–96.50 region — a level that has now held multiple times over the past several months. Momentum has turned slightly constructive in the short term, but Read More…

S&P 500
Technical Analysis

S&P 500 (ES) Technical Analysis, 17 February 2026

Introduction S&P 500 E-mini futures have pulled back from the 7,000 area after multiple tests of resistance. This was the formation of the ATH too, and now the price appears to be in a range between 6,800 and 7,000. There is some profit-taking happening which is why ES is no longer forming higher highs and Read More…

dow jones
Technical Analysis

Dow Jones Futures (YM) Technical Analysis, 16 February 2026

Introduction Dow Jones E-mini futures continue to grind higher, pressing back toward recent highs near 50,000. Unlike the more volatile NASDAQ, the Dow’s rally has been steadier, a trend followers dream. However, momentum is no longer expanding aggressively. The market is advancing but doing so in a more controlled, mature fashion. Each time the 50 Read More…

NQ
Technical Analysis

NASDAQ (NQ) Technical Analysis, 13 February 2026

Introduction NASDAQ 100 E-mini futures are showing signs of exhaustion after forming a double top structure near the 26,000 area. Price has now rolled over from that resistance zone and is slipping back below the 50-day moving average. Momentum has weakened noticeably, and the trend is no longer higher highs and higher lows but a Read More…