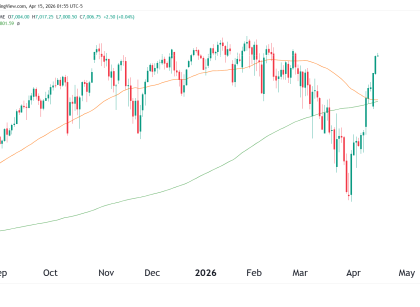
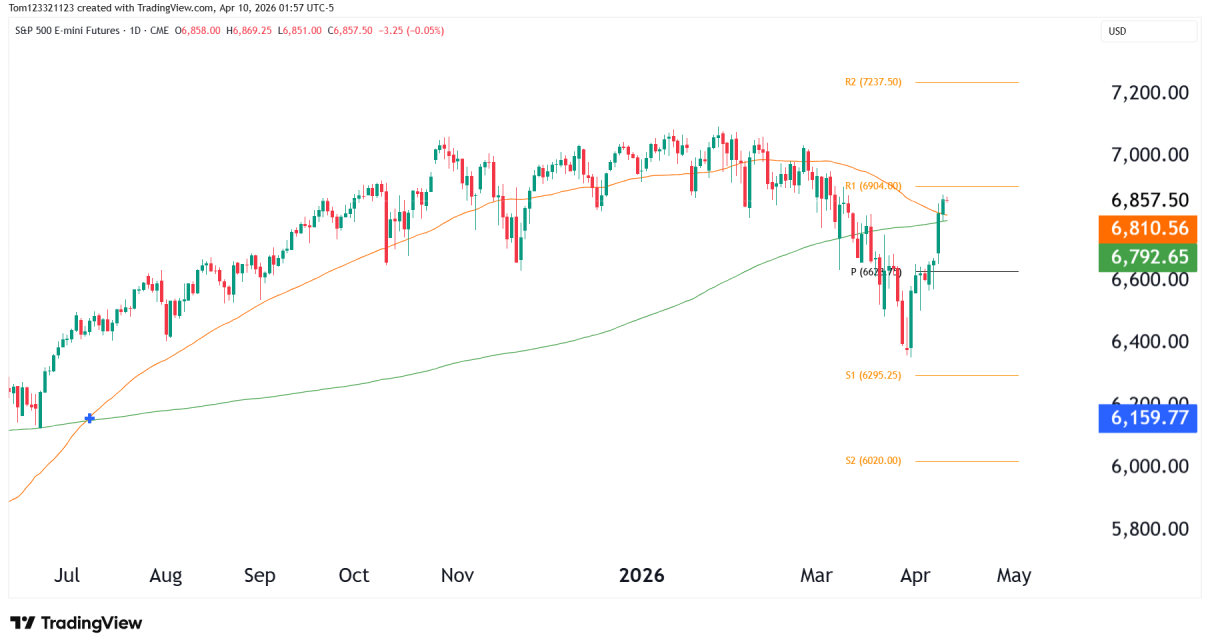
Introduction Crude oil markets remain under pressure as the multi-year pullback continues, with CL trading near a well-defined long-term support zone mentioned in our previous analysis. Price has retraced sharply from the 2022 highs and is now trying to stabilize after months of lower highs and lower lows. While volatility has cooled compared to prior Read More…
Technical Analysis
S&P 500 Futures (ES), Technical Analysis 12 January 2026
Introduction US equity markets continue to rally and ES is no exception. The S&P 500 is trading near all time highs with the daily chart painting higher highs and higher lows. There is optimism around economic growth and an easing of monetary policy which is playing a role in the bullish momentum of ES. The Read More…
Gold Futures (GC) – Technical Analysis 9 January 2026
Introduction Gold futures (GC) are trading near their all-time high once more as bulls have regained control over the yellow metal. Interest rates & real yields as well as rate cut expectations, are having a positive impact on the price for 2026. The US Dollar has also weakened, which, because Gold is priced in Dollars, Read More…
Dow Jones Futures (YM) – Technical Analysis 8 January 2026
Introduction YM has broken above its prior all-time high further showing the strength that all US equity markets have at the moment. Every small dip is getting bought up by the bulls, and the market is firmly bullish. The moving averages are also sloping upward, with the 50 well above the 200, with the price Read More…
Crude Oil Futures (CL) – Technical Analysis 7 January 2025
Introduction Crude oil (CL) continues to trade just above the critical support level between $55 and $56. The price has bounced out of this level five times since April as bulls step in to defend the price level. Overall, the trend is bearish in the long term, but the bulls holding above the support level Read More…
Nasdaq 100 Futures (NQ) – Technical Analysis 6 January 2026
Introduction The long-term NQ trend continues to the upside along with the other US index markets. The price has been consolidating, however, since hitting an ATH of 26,399 in November, and a symmetrical triangle is now forming. Traders and investors are watching U.S. inflation data, labor market reports, and the FOMC, and any bullish developments Read More…


