


Introduction
The Nasdaq rally continues along with all other US equity markets. Since April, there have been only 8 red days, which are quickly bought back in the next session.
What stands out most now is the pace of the move. The Nasdaq has added thousands of points in a relatively short period of time, driven by aggressive momentum buying, strong earnings from large-cap tech companies, and growing optimism that the Federal Reserve is moving closer toward easing financial conditions later this year.
Lets take a closer look at the technicals and what they are telling us.
NQ Daily Chart
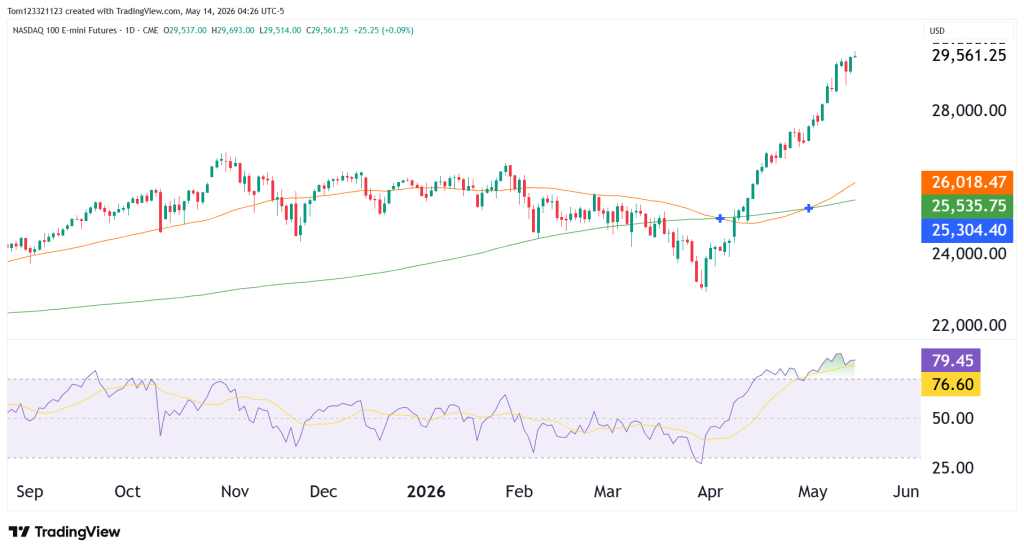
The daily chart remains extremely bullish.
NQ has now broken decisively above previous highs and is trading near 29,500, while continuing to hold comfortably above both the 50-day and 200-day moving averages. The recovery from the March lows has been almost vertical, and buyers continue defending even small intraday pullbacks.
Momentum indicators are now becoming heavily extended. RSI is trading near 80, which reflects how aggressive this rally has become. In weaker markets, that type of reading often leads to sharp pullbacks, but in strong momentum environments, it can simply mean buyers remain firmly in control.
Weekly Chart
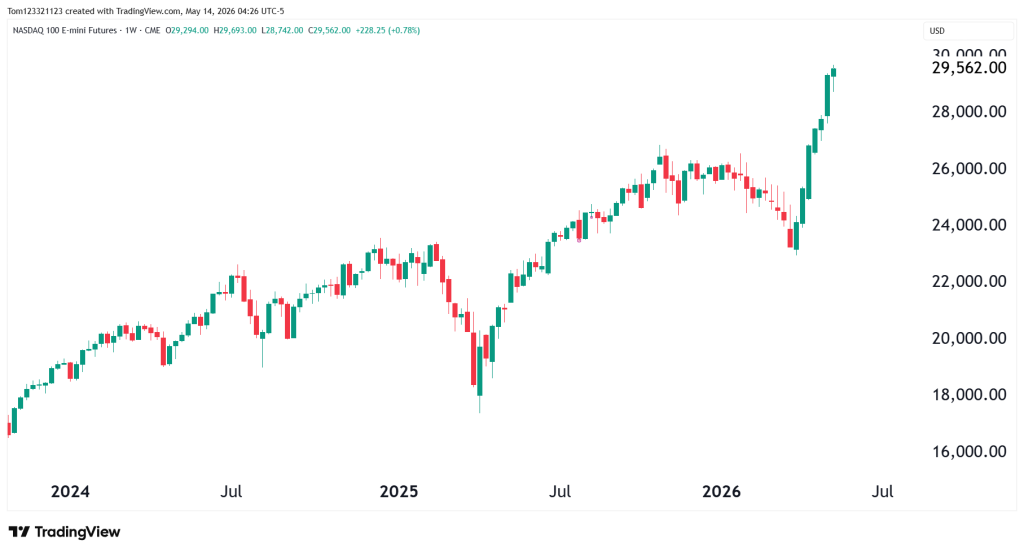
NQ is now trading at fresh all-time highs after fully recovering from the March correction, and the broader trend still looks extremely strong. What makes this breakout important is that it follows a clean recovery from a major weekly pullback rather than a slow sideways consolidation.
The current weekly candle structure shows continued momentum, with buyers still controlling the larger timeframe trend. There is very little historical resistance above current price levels, which means the market is now trading in price discovery territory.
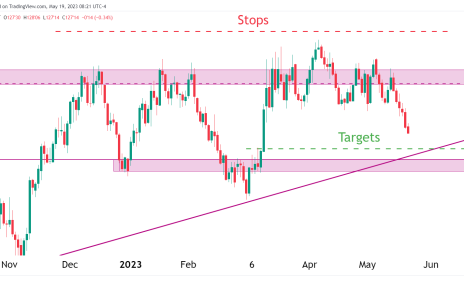
Moves like this cant go on forever and mean the pullbacks can be sharp, similar to what we saw recently in the gold chart. They also lead to consolidation periods.
Key Levels
- Immediate resistance: 29,700–30,000
- Near-term support: 28,800–29,000
- Major breakout support: 27,500–28,000
- 50-day moving average: ~26,000
As long as NQ continues holding above the breakout region near 28,800, buyers remain fully in control of the trend structure.
Upcoming Events
The Nasdaq continues reacting heavily to interest rate expectations and large-cap technology earnings.
Recent inflation data has helped support the idea that the Federal Reserve may eventually begin loosening policy later this year, and growth stocks have responded strongly to that shift in expectations.
AI-related momentum also remains a major driver behind the rally. Large-cap technology names continue attracting strong inflows, and that strength keeps feeding directly into NQ futures.
At the same time, traders are still monitoring Treasury yields closely. If yields begin rising aggressively again, high-growth sectors could eventually face pressure after such an extended move higher.
Geopolitical risks also remain in the background, particularly developments in the Middle East and their effect on oil prices and inflation expectations.
Scenarios and Probabilities
| Scenario | Description | Estimated Probability |
|---|---|---|
| Continued Rally | Momentum pushes NQ toward 30,000+ | 50% |
| Consolidation | Sideways movement after extended rally | 35% |
| Pullback | Profit-taking leads to retracement toward 28,500 | 15% |
Possible Trades
Long setups still favor pullbacks into support rather than chasing extended breakout candles after such a strong run higher.
Momentum traders will likely continue focusing on continuation patterns as long as buyers defend short-term dips and volatility remains controlled.
Short setups become more attractive only if momentum begins fading while price loses key breakout support underneath.
This analysis is provided for educational and informational purposes only and should not be considered financial or trading advice. Trading futures, forex, and other leveraged financial instruments carries a high level of risk and may not be suitable for all investors. Past performance is not indicative of future results. Before making any trading decisions, conduct your own research, assess your risk tolerance, and consult with a qualified financial advisor if necessary.
