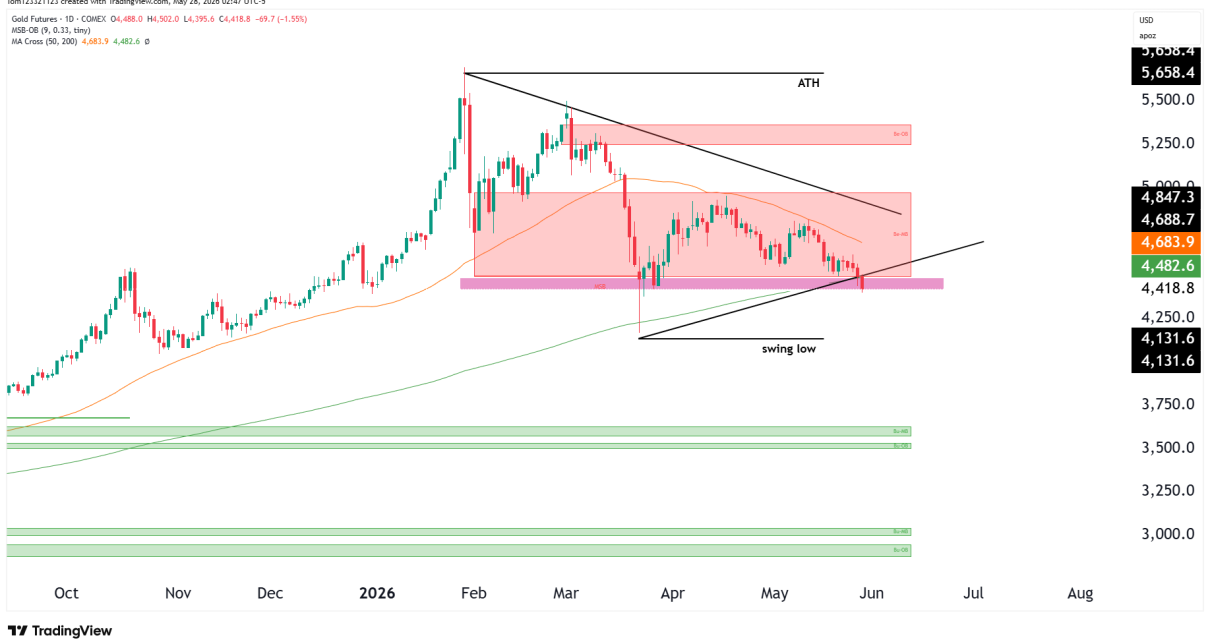
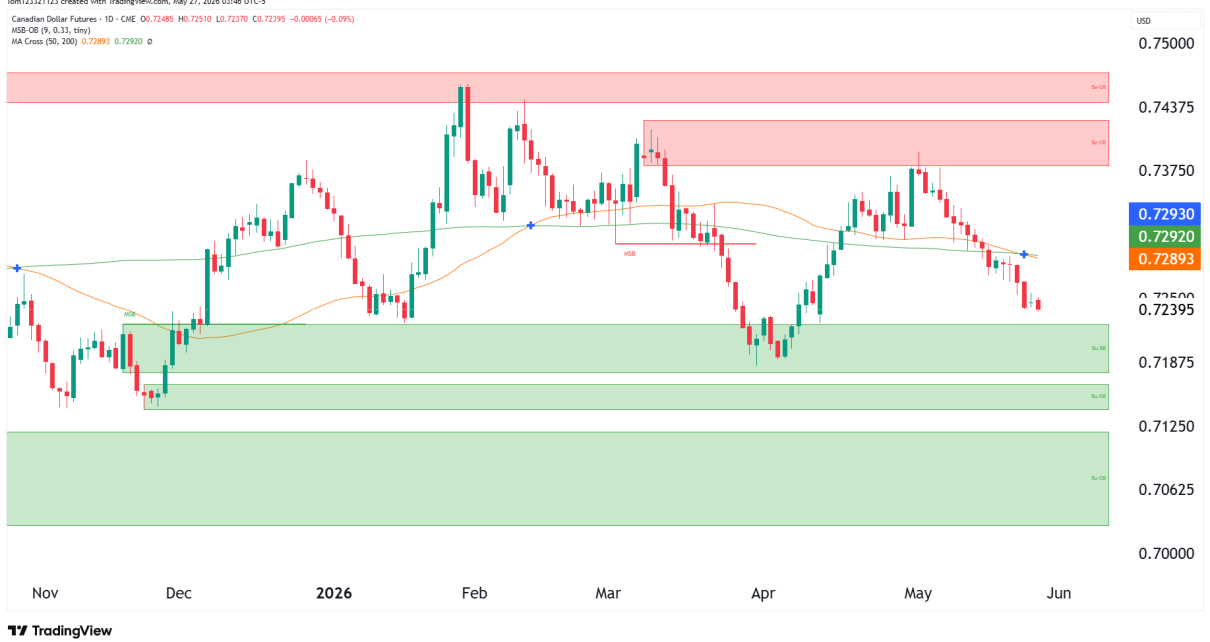
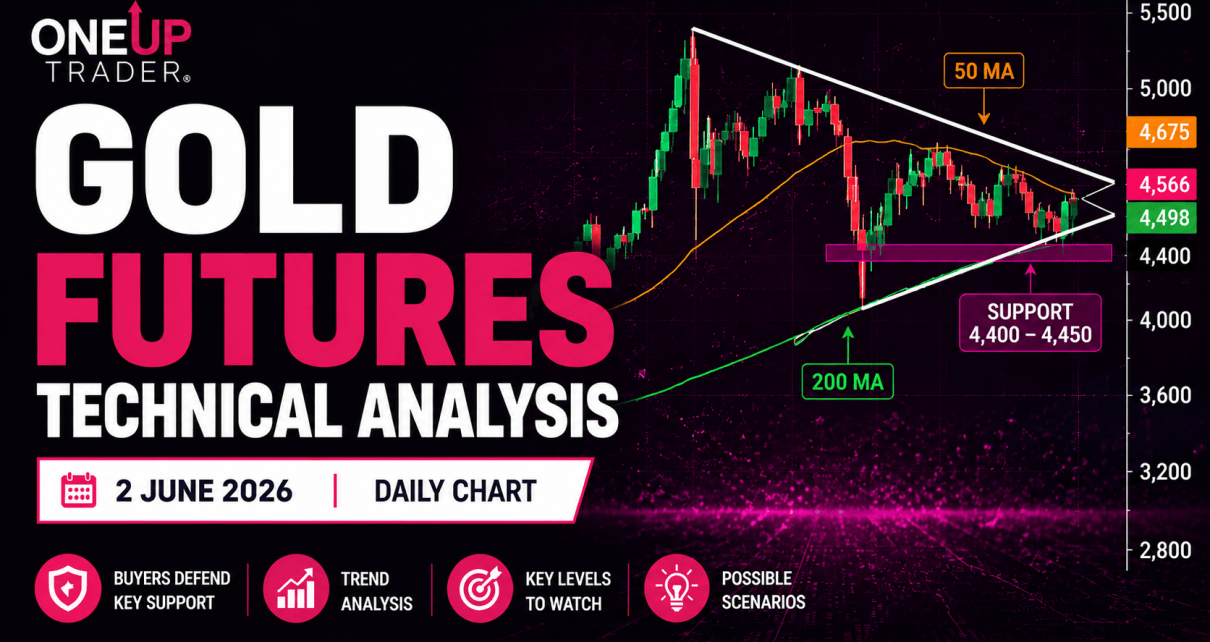
futures trading strategies for beginners
Technical Analysis

Bitcoin Surges above $52,000; Upside Expected

Weekly Chart The weekly time frame shows that price is approaching the previous all-time high, a big milestone for Bitty. The swing high extensions (Swing:SH Ext at 32165) serve as a reference point for potential resistance on further moves up. This swing indicator will likely print a higher low soon around $40,000. Key Levels to Read More…

Technical Analysis

Dow Jones Futures (YM) Spinning Top Candlesticks

Weekly Chart The weekly chart has formed spinning tops near the recent all-time high. This tells us that there is indecision in the market. The RSI is currently overbought at 71.31. before the formation of the spinning tops there was only 1 red week out of 14. This amount of bullish price action cannot last Read More…

Nasdaq 100 index futures (NQ)
Technical Analysis

Nasdaq futures (NQ) sell-off in volume spike

Weekly Chart The weekly chart shows a strong uptrend with the Relative Strength Index (RSI) reading above 60, this is still strong bullish momentum. The volume on the weekly has been consistent as the trend continues to make higher highs. For traders looking to join the uptrend, a pullback toward the RSI-based Moving Average (MA) Read More…

Technical Analysis

Gold Futures: Decisive Breaks and Key Levels to Trade

Weekly Chart Analysis of Gold Futures The weekly clearly shows the market is consolidating. The Fibonacci retracement levels from the recent swing high and low indicate that the price is hovering around the 100 level (previous all time high). Bulls still need to see a decisive break above this in order to continue with the Read More…