

Introduction
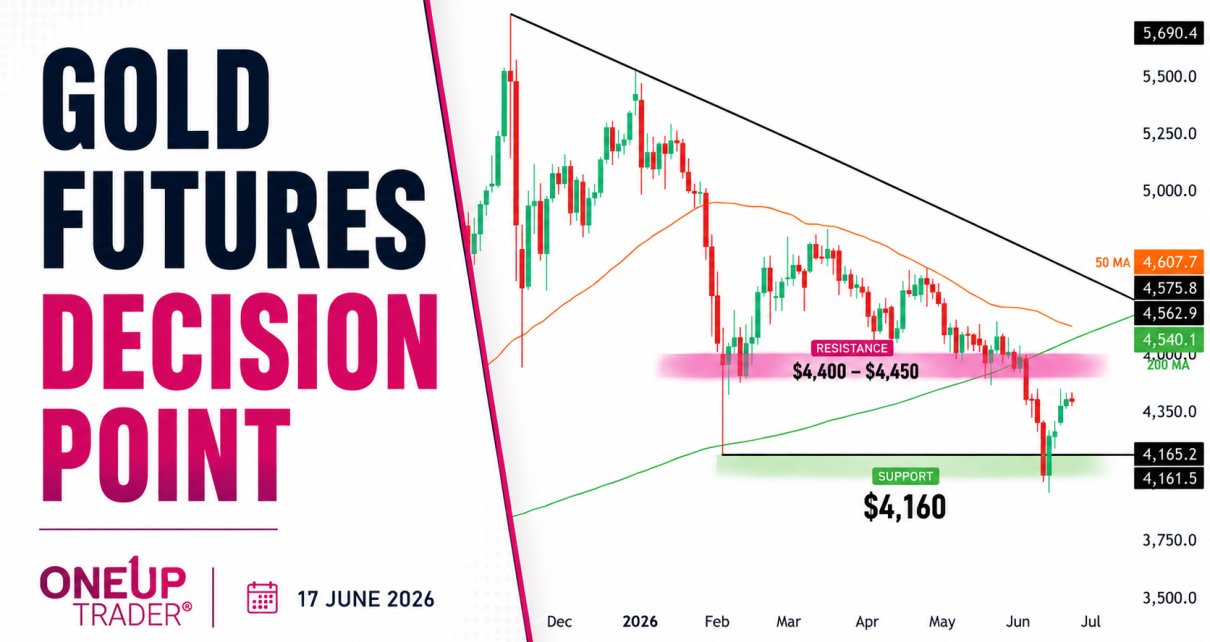
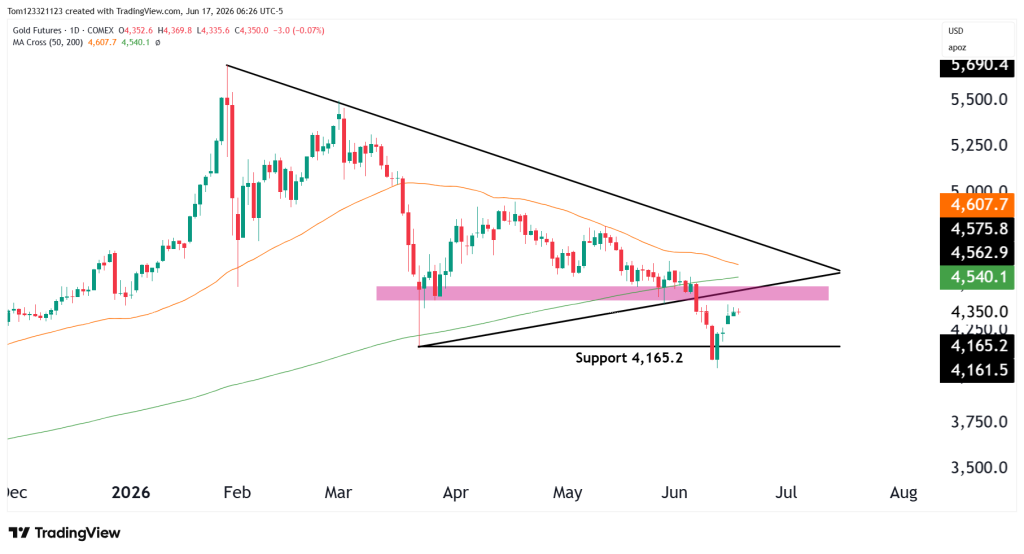
Our June 10 analysis focused heavily on the importance of the $4,160 support level after Gold broke below the ascending trendline and former support zone near $4,400.
The good thing for the bulls is that price was able to hold the support level at $4,165.2. We could see a new test of this level soon however.
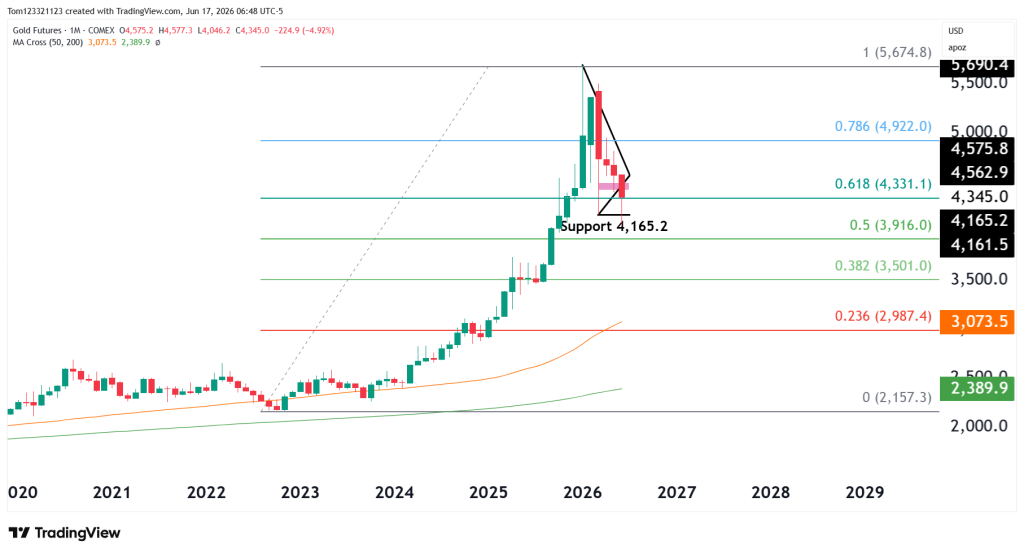
There is definitely less of a buying appetite in the GC market, but time frame is everything on this because a monthly chart looks like nothing more than a small pullback.
Gold Futures Trend Analysis
Current technicals show:
- The 50-day moving average near $4,608
- The 200-day moving average near $4,540
- Current price trading around $4,350
- Major support holding near $4,160
- Former support zone near $4,400–$4,450 now acting as resistance
The challenge for bulls is that despite the bounce, price remains trapped beneath the same resistance zone that failed earlier this month.
From a market structure perspective, this still looks more like a relief rally within a correction than the beginning of a new uptrend.
For the outlook to improve materially, buyers need to reclaim the $4,400-$4,450 region and hold above it. Until that happens, rallies will continue to face pressure from sellers looking to defend the breakdown.
Estimated Probabilities for Gold Futures
| Scenario | Estimated Probability | Market Interpretation |
|---|---|---|
| Consolidation between 4,160 and 4,450 | 45% | Market stabilizes after the recent selloff |
| Breakdown below 4,160 support | 35% | Sellers regain momentum and continue the correction |
| Recovery above 4,450 resistance | 20% | Buyers reclaim key levels and improve the outlook |
Key Support and Resistance Levels
Major Resistance Levels
- 4,400–4,450
- 4,540 (200-day moving average)
- 4,608 (50-day moving average)
Major Support Levels
- 4,160 swing low
- 4,000 psychological support
- 3,500–3,600 longer-term demand zone
Gold Futures Possible Trades
Consolidation Trade Setup
This is becoming the most likely short-term scenario. Gold has found support at a major swing low, but buyers have not yet reclaimed the resistance levels.
Bearish Continuation Trade
The longer-term correction remains intact while Gold trades below the broken support zone and beneath the major moving averages. If resistance holds and sellers push price back toward $4,160, another breakdown attempt becomes increasingly likely.
Bullish Recovery Trade
For bulls, the next objective is clear. Price needs to reclaim the $4,400-$4,450 resistance zone and begin building acceptance above it. If that happens, the recent breakdown would start looking less convincing and could open the door for a larger recovery toward the moving averages.
This analysis is provided for educational and informational purposes only and should not be considered financial or trading advice. Trading futures, forex, and other leveraged financial instruments carries a high level of risk and may not be suitable for all investors. Past performance is not indicative of future results. Before making any trading decisions, conduct your own research, assess your risk tolerance, and consult with a qualified financial advisor if necessary.

