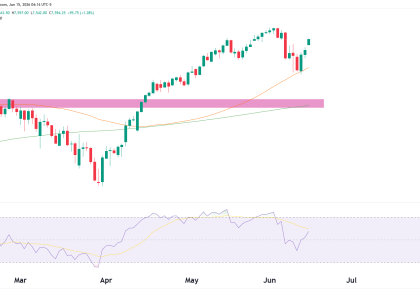
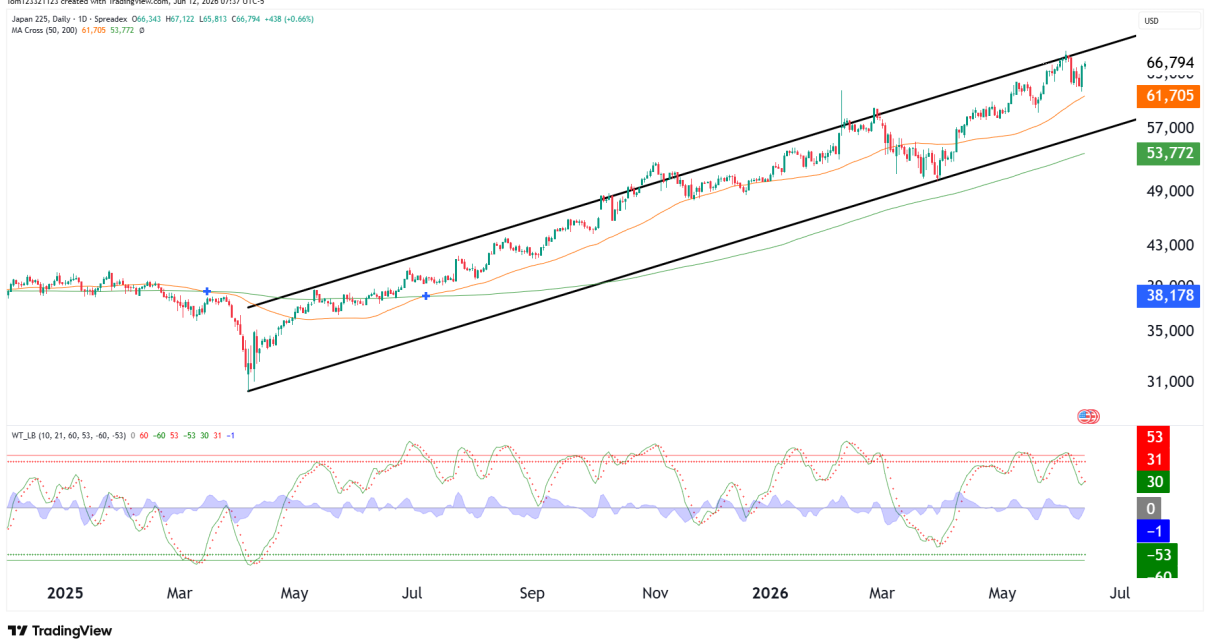
Introduction ES has staged a sharp bounce from the 6,300–6,400 selloff low, pushing back up toward the 6,800–6,900 resistance zone. This is happening across all equity markets because of the ceasefire in the Middle East. Some reports though are showing that the deal Donald Trump made with Iran is not playing out exactly as he Read More…
Technical Analysis
Bitcoin Futures (BTC) Technical Analysis 9 April 2026
Introduction Bitcoin is no longer in an uptrend. The structure has clearly shifted over the past few months and the question now is whether price is going to find support at the current level and claw its way back up or if its going to continue downward. After topping out near the 120K–130K area, BTC Read More…
Where Will NASDAQ (NQ) Go Now After Ceasefire?
Introduction Nasdaq futures have bounced 10% from their recent low after the news of a ceasefire in the Middle East. This has given the bulls a boost as price is currently trading above both the 50 and 200 moving average. There was a recent death cross where the 50 moved below the 200, but as Read More…
Dollar (DXY) Technical Analysis – 8 April 2026
Introduction The dollar is still trading inside a broad range, but the recent price action is starting to lean weaker after the ceasefire in the Middle East. After pushing up toward the 100–101 area, DXY has failed to hold those gains and is now drifting back lower. This is the same zone that has acted Read More…
Crude Oil (CL) Technicals Post Cease Fire In Middle East
Introduction Crude oil has shifted quickly from a clean uptrend into a sharp corrective move, with price dropping roughly 15% following news of a ceasefire in the Middle East. The Strait of Hormuz has been open for two weeks, allowing the Oil ships to exit and enter the region. This has given some hope to Read More…
Gold Futures (GC) Technical Analysis 7 April 2026
Introduction Gold finally had a retracement since the record-breaking rally started in February of 2024. The pullback was 27% from its high in January, but the 200-day moving average held its line. A bullish candle formed on the day the price tested that moving average and bounced. The key event was the breakdown from the Read More…


