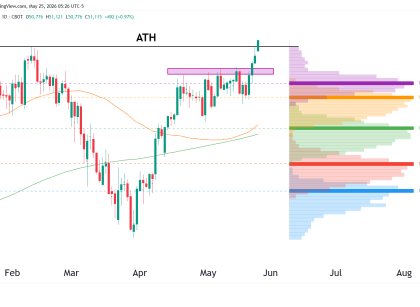
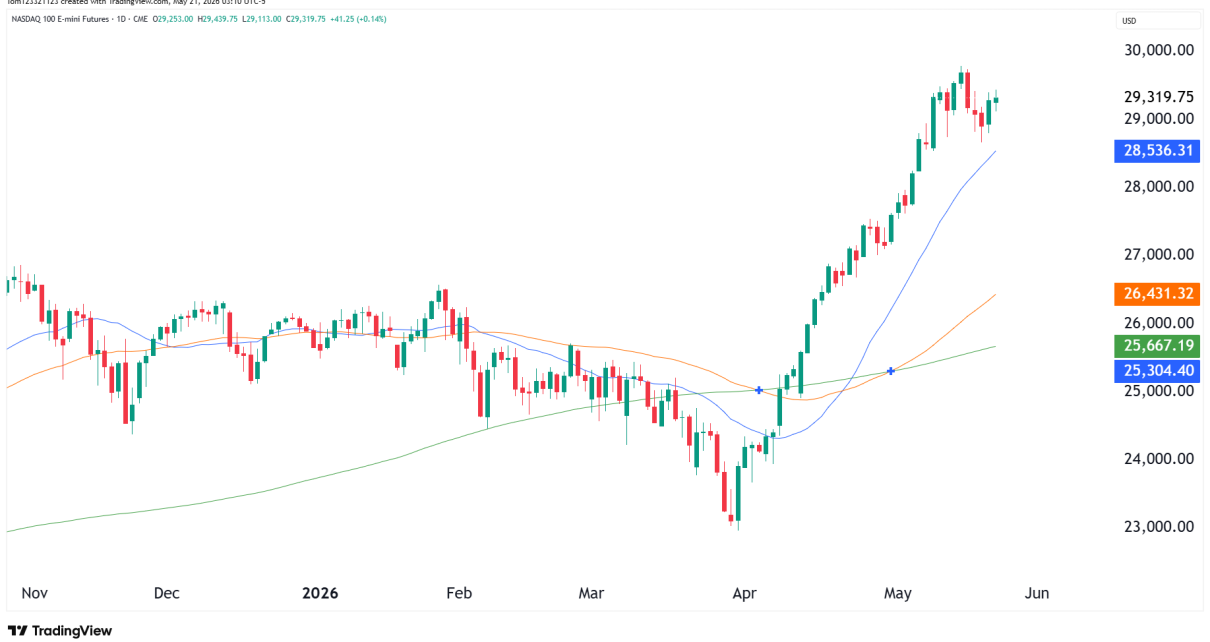
Technical Analysis

Gold Futures: Decisive Breaks and Key Levels to Trade

Weekly Chart Analysis of Gold Futures The weekly clearly shows the market is consolidating. The Fibonacci retracement levels from the recent swing high and low indicate that the price is hovering around the 100 level (previous all time high). Bulls still need to see a decisive break above this in order to continue with the Read More…

Nasdaq 100 futures (NQ)
Technical Analysis

Are Nasdaq futures (NQ) overbought?

Weekly Timeframe Analysis:On the weekly chart, we can see price has been in a solid uptrend since the beginning of the year. The Relative Strength Index is currently in overbought territory. Despite the overbought RSI, we should consider the prevailing uptrend as the dominant force until price action suggests otherwise. Daily Timeframe Analysis:The daily chart Read More…

S&P 500 futures
Technical Analysis

Technicals get out of hand in S&P 500 futures (ES)

Weekly Chart Observations: ES has been getting out of hand lately and just continues to rally no matter what. The Alligator indicator has the Lips (4821.50), Teeth (4733.71), and Jaw (4631.17) fanning out, which confirms the trend strength. Taking shorts now is highly risky and the only thing that could stop this market from going Read More…

Crude Oil Futures
Technical Analysis

Crude Oil futures gear up for bullish breakout

Weekly Chart: The price action is hovering above an established multi-year support zone that is the main point for the bull’s case. The Alligator indicator shows the Jaw, Teeth, and Lips converging, signaling a potential consolidation phase. However, with the price maintaining levels above the Alligator’s Lips, we maintain a bullish outlook. The RSI is Read More…

Technical Analysis

Bulls target $2,600 in gold futures (GC)

Weekly Chart Analysis:The weekly chart shows a consolidation below the previous all-time high (ATH) with most dips generally being bought back up. The resistance level to watch is the previous ATH at $2089.0. A decisive weekly close above this level could signal a bullish continuation, potentially targeting the bull target zone around $2400.0. However, should Read More…

S&P 500
Technical Analysis

S&P 500 still bullish as traders buy above all-time high

S&P 500 (ES) Weekly Chart Analysis: The S&P 500 E-mini Futures have demonstrated a robust uptrend, reflected in the rising channel on the weekly chart. The market recently pushed through the resistance marked by the previous all-time high, establishing a significant bullish sentiment. Current resistance sits at the upper boundary of the channel near the Read More…