- Full analysis on Monthly, Weekly, and Daily time frames.
Introduction and recap
The last time we looked at ES, it was in the process of a pullback toward the 50 and 100 moving averages. This retracement has been minor, with the market giving back 3.8% since the most recent top on the daily chart. ES is still only 3.8% away from all-time highs. Let’s take a fresh look at the technicals of all time frames.
Monthly Chart
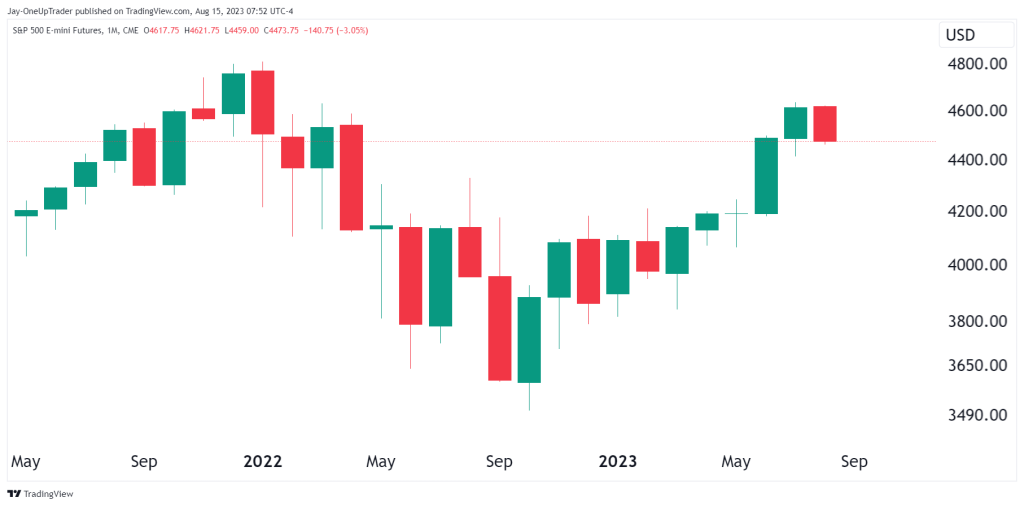
The monthly chart has seen five months of consecutive green closes. August is the first month showing signs of a potential red close but there is still some time to go before we can know. If we zoom out, it appears to be just a standard pullback on the monthly time frame in the macro bull trend. Are the days of 50% stock market pullbacks over for good? The biggest retracement in the ES since 2008 was during the Covid crash, which was 36% from top to bottom. That also happened in a period of two months so it wasn’t even a ‘real bear market’. With this in mind, finding short opportunities in the market will be much more difficult. Shorts also have a limited amount of time to hold onto their position because markets tend to go up over the long hall.
Weekly Chart
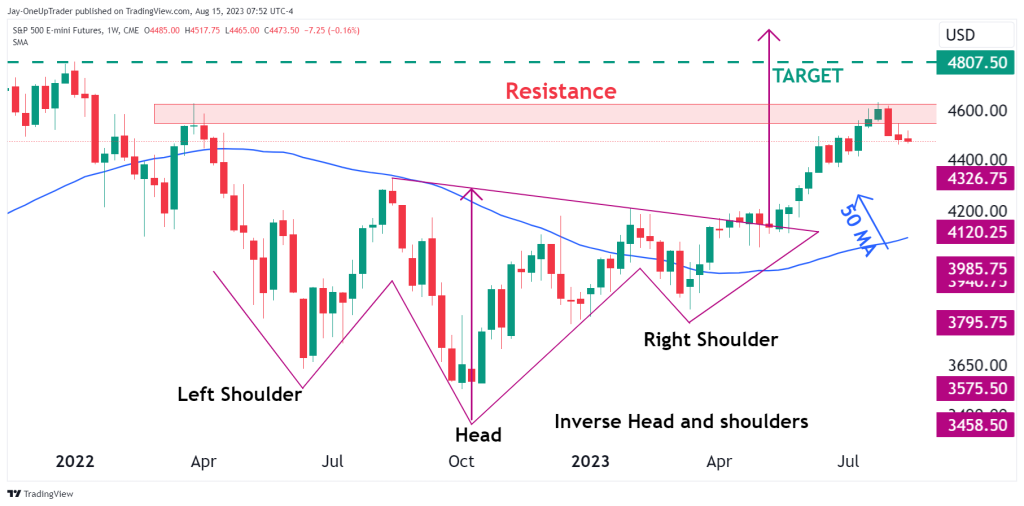
The inverse head and shoulders we have been tracking for months can be easily seen on the weekly chart. The all-time high was just in sight but sellers were found around a small resistance level near the all-time high. The resistance level is the part on the chart I circled. This is a period where the buyers make their last attempt to push the market higher, but the traders who got in much earlier use that rally to lock in profits that they didn’t lock in at the high of the move. I don’t see this as a significant level for the bulls to worry about, and if we think in probabilities, we could say we have a much higher chance of the level getting broken than the market completely reversing now and plunging us into another bear market.
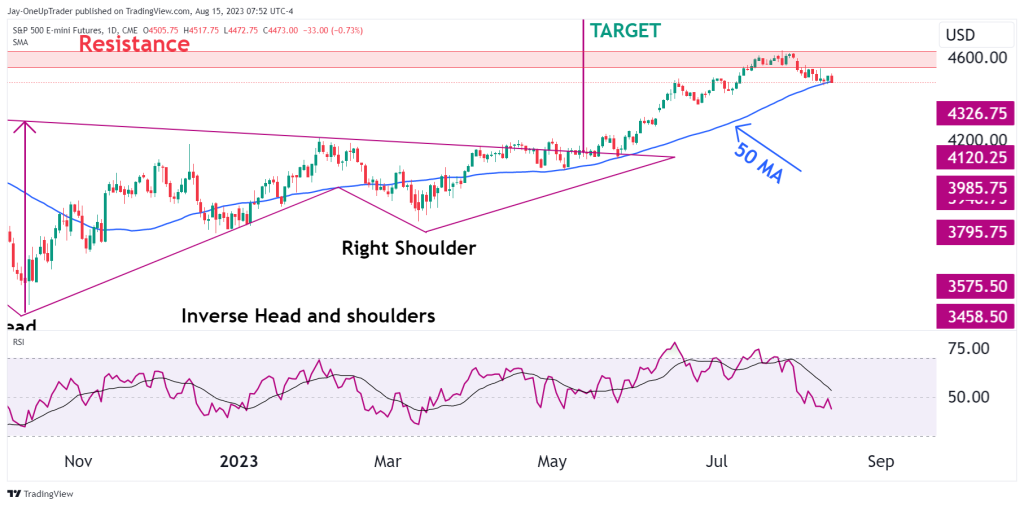
Daily Chart
There are two main indicators I would like to point out on the daily chart. The 50 moving average and the RSI. Currently, the market is testing the 50-day moving average, and bulls are hoping it will act as support. The RSI has crossed below 50, so I want to see a consolidation phase before considering going long. On the daily chart, if the RSI crosses below 50 and doesn’t immediately reverse back above it, it is a bearish sign but it doesn’t mean a downtrend is coming. It means there are a bit more sellers in the market currently to take a long position. It is better in that situation to wait for a consolidation or flattening on the chart.