

Introduction
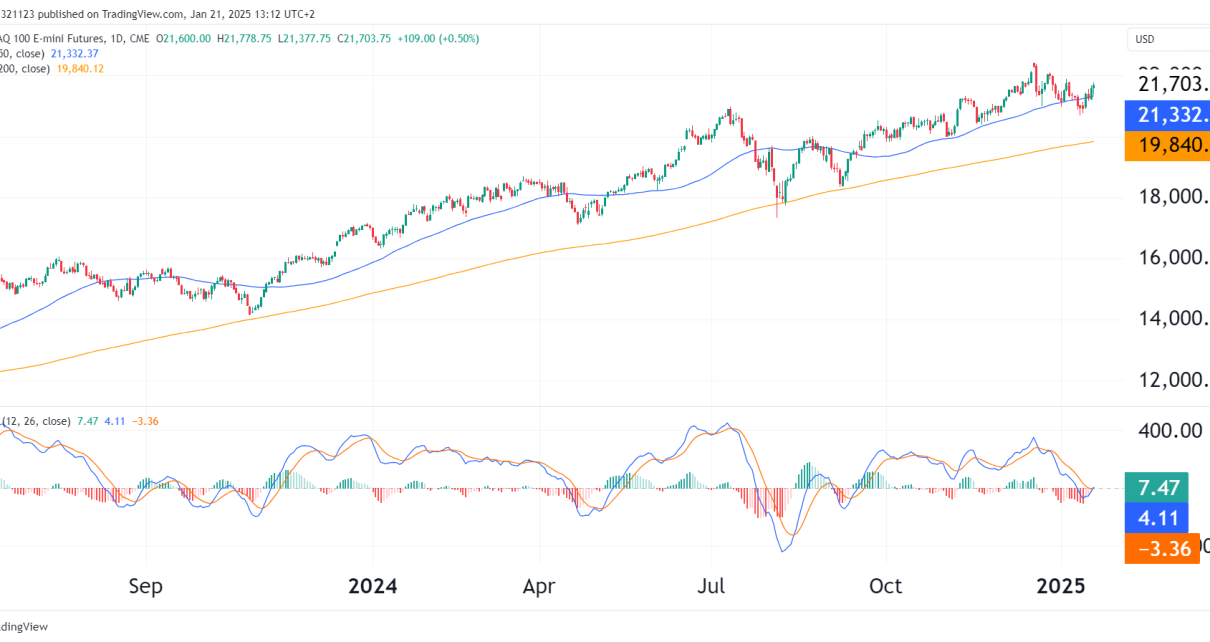
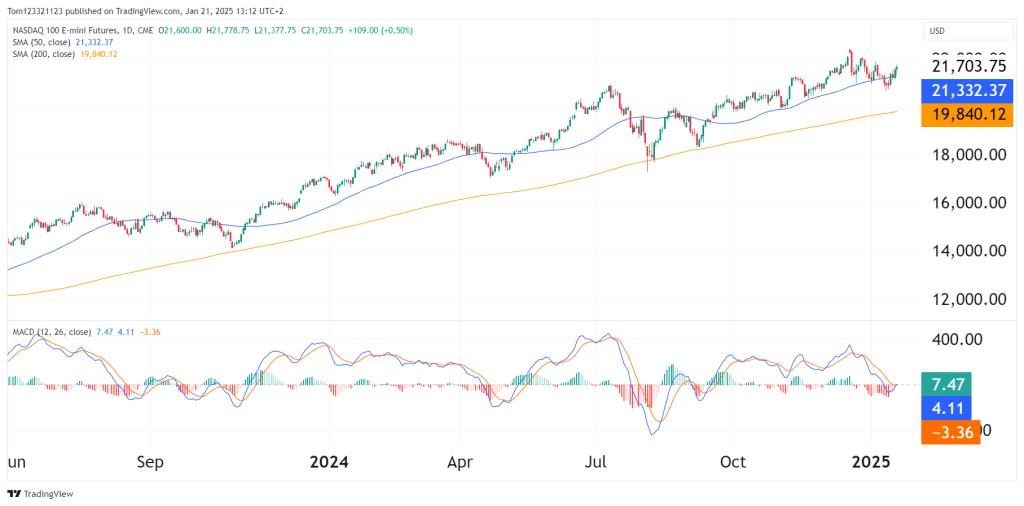
The NASDAQ 100 E-mini Futures (NQ) are trading at 21,703.75, continuing their upward trajectory following the recent inauguration of President Trump. Traders and investors are pricing in optimism on pro-growth economic policies, contributing to the strength in equities.
Technical Analysis Overview
Trend and Structure:
- NQ remains in a well-established uptrend, consistently making higher highs and higher lows, supported by the 50-day SMA (21,332.37) and the 200-day SMA (19,840.12).
- Recent price action shows a bounce off the 50-day SMA, confirming it as dynamic support and reinforcing bullish momentum.
Support and Resistance Levels
Resistance Levels:
- 21,800 – 22,000: Immediate resistance zone, aligning with previous swing highs. A break above this level could trigger a continuation toward new all-time highs.
- 22,500: Psychological resistance level and a potential next target if bullish momentum persists.
Support Levels:
- 21,332 (50-day SMA): Immediate support, which has acted as a launchpad for recent moves higher.
- 20,800: A strong horizontal support zone and the recent local low.
- 19,840 (200-day SMA): A critical longer-term support level, maintaining the structural uptrend.
Indicators Analysis
MACD (Moving Average Convergence Divergence):
- The MACD line is at 7.47, above the signal line at 4.11, and bullish momentum is gaining strength.
- The histogram has turned positive, so there is potential for further upside if momentum sustains.
- A bullish crossover occurred recently, reinforcing the case for continuation higher.
Moving Averages:
- The 50-day SMA (21,332) is trending upward, confirming short-term bullish momentum.
- The 200-day SMA (19,840) remains supportive of the broader bullish trend, indicating strong long-term support.
Scenarios to Watch
Bullish Case:
- A sustained move above 21,800 would confirm the continuation of the uptrend, targeting the 22,000 – 22,500 zone.
- Positive sentiment surrounding economic policies and fiscal stimulus could further fuel buying interest, pushing NQ into price discovery mode.
Bearish Case:
- A failure to hold above the 50-day SMA (21,332) could lead to a pullback toward the 20,800 support zone, with further downside risk to the 200-day SMA at 19,840 if selling accelerates.
- Any unexpected economic data or policy shifts could create volatility and stall the current bullish momentum.
Trade Ideas
Bullish Setup:
- Entry: Long positions above 21,800, targeting a breakout continuation.
- Targets:
- First target: 22,000.
- Second target: 22,500 (ATH).
- Stop-Loss: Below 21,500 to minimize risk.
Bearish Setup:
- Entry: Short positions on a rejection from 21,800, targeting a retracement to key support levels.
- Targets:
- First target: 21,332 (50-day SMA).
- Second target: 20,800.
- Stop-Loss: Above 21,900 to manage risk.
