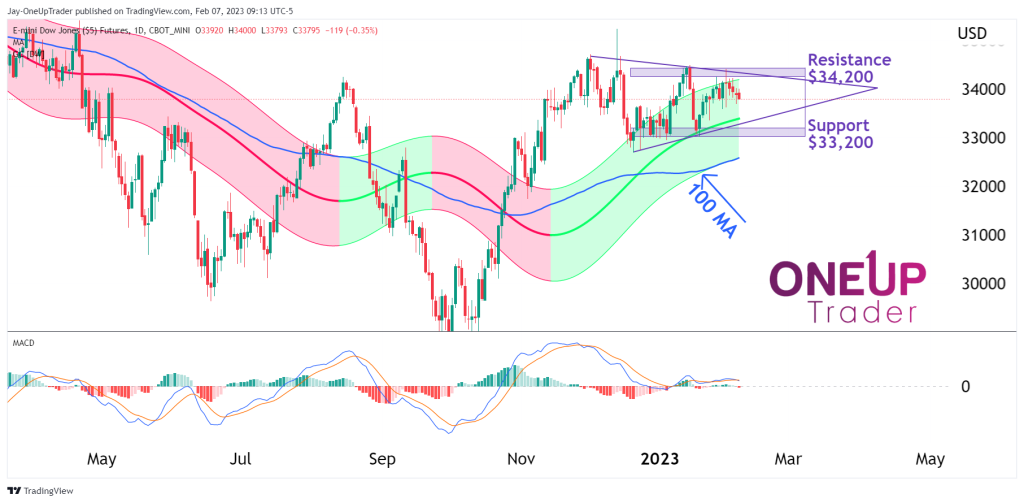
- Pole & Triangle formation showing a strong potential rally is on the cards.
- Gaussian channel providing long entries on pullbacks for bulls.
- Macd confirms a period of consolidation.
Technical Indicators
Pole & Triangle:
There was a strong rally before the triangle started forming. During this period of consolidation (Triangle), price has moved sideways, and this is a good sign for bulls. Now as the sellers reduce their positions, the market prepares for a continuation rally if the fundamentals align.
Im not going to extend a price target since the Triangle has not been broken and still has a chance of breaking to the downside. Price is likely to continue testing the lower range of the Triangle at $33,200 and the upper range at $34,200.
The Gaussian channel is proving to be a strong support channel as price retraces into the zone. Traders can monitor this for potential long entries.
MACD:
The macd has ‘squeezed,’ and the histogram is very flat. This is a strong bullish sign after a powerful up move because it suggests a coiling up period where price could spring out and continue with the prior trend.
Potentialities
YM diverged for the majority of last year compared to other indices. Price is stuck within a range that range-bound strategies can take advantage of. At the moment, the industrial average is still bullish in its medium to long-term outlook.