Follow-Up: What Played Out Since August 4
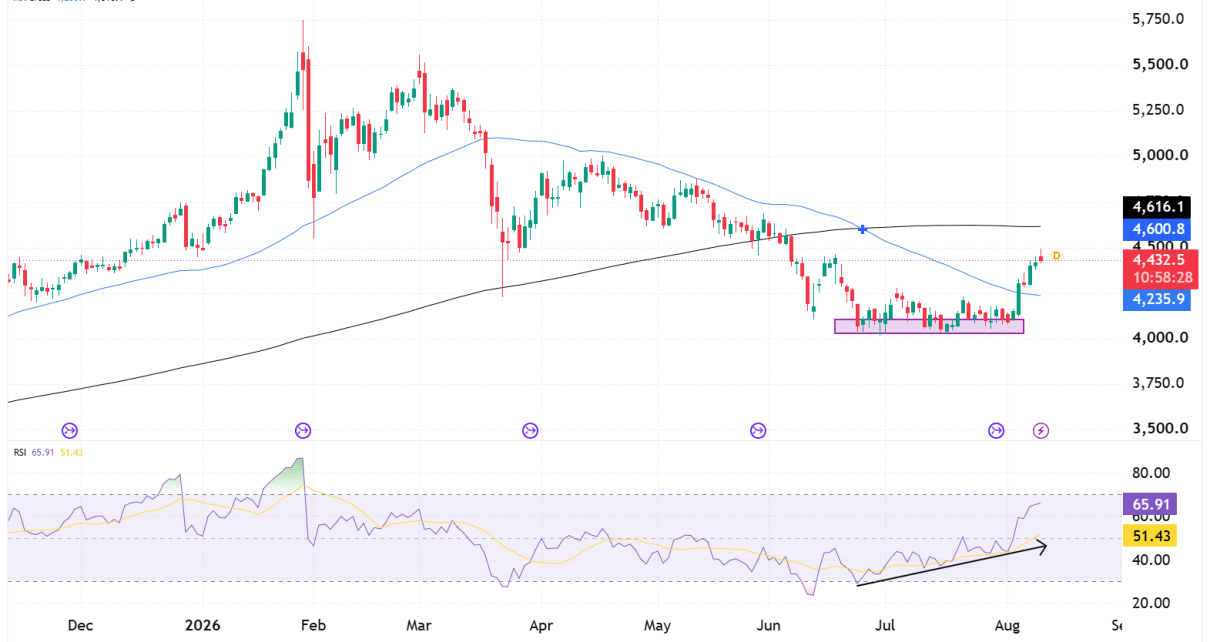
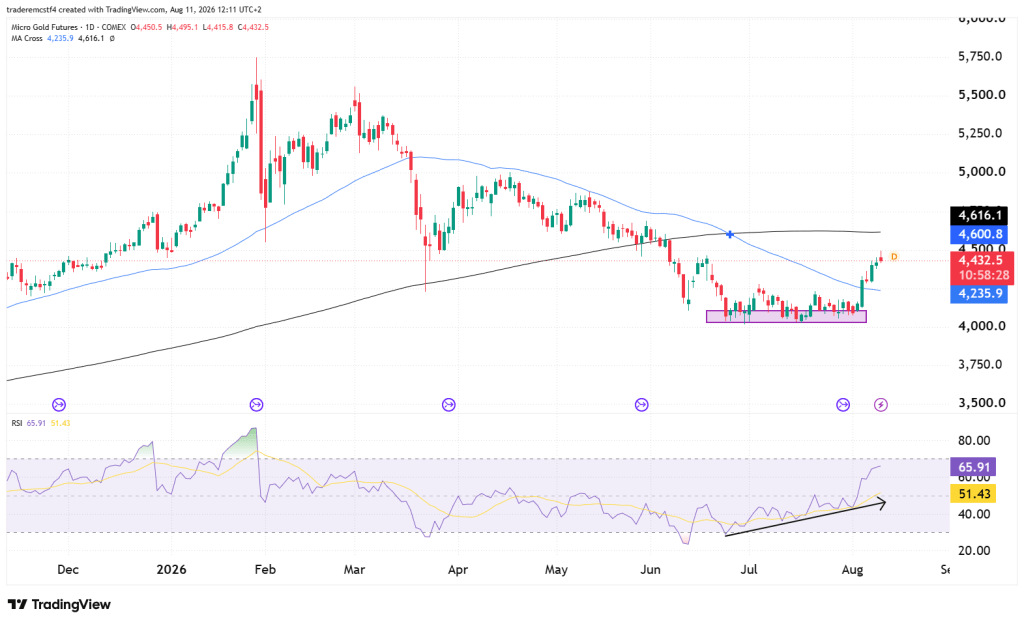
Gold has done exactly what we were watching for. In our previous analysis, price was stuck at 4,118.8 in a tight range between 4,050 and 4,200, and the one thing we singled out was a quiet series of higher lows building in RSI while price went nowhere. That pattern resolved to the upside, and fast — gold added more than 310 points in five sessions, a 7.6% run that cut through our 4,300–4,400 target and reached 4,432 by the August 11 session.
The question now is whether there’s enough fuel left to challenge the 4,600 cluster that has capped every rally since June, or whether a 7.6% move in a week is due a pullback first.
What’s Driving the Move
- A badly missed jobs report reset rate expectations. The BLS reported 23,000 jobs lost in July against expectations of 80,000 gained, prompting analysts to pare back expectations of a Fed rate increase in September — removing gold’s biggest headwind.
- Falling energy prices are helping. The same Hormuz progress that knocked crude down 11% in three sessions has softened the risk of higher rates for bullion holders by cooling inflation worries. Gold opened above $4,300 on August 6 for the first time since June 17.
- The move is broad, not thin. Spot turnover jumped roughly 95% and futures open interest climbed at a similar pace alongside the price move.
The caution: two inflation reports land this week and are expected to show price pressures building. Hot prints put rate-hike expectations straight back on the table.
Technical analysis gold futures GC
Price has reclaimed the 50 moving average, which is finally turning higher after months of decline. The 200 average remains overhead and is the line separating a strong bounce from a real trend reversal — gold hasn’t traded above it since June. RSI at 65.89 is the strongest reading since spring, approaching overbought without reaching it, though a jump from the mid-40s to mid-60s in five sessions often needs cooling off. Zoomed out, gold is still 21% below its January peak just under 5,600.
Key Levels
Resistance
| Level | Notes |
|---|---|
| 4,495 – 4,500 | August 11 high plus round-number resistance |
| 4,600 – 4,616 | The main event: marked level converging with the slower moving average, capping price since June |
| 5,000 | Next structural target if 4,616 breaks |
Support
| Level | Notes |
|---|---|
| 4,415.8 | August 11 low |
| 4,300 | Breakout shelf from August 6; first real support |
| 4,235.9 | Faster moving average — must hold to keep the breakout intact |
Possible Trades
Bullish continuation
- Entry: daily close above 4,500
- Stop: below 4,415.8
- Target: 4,600, then 4,616 — take partials into the cluster rather than expecting a clean first break
Pullback / fade
- Entry: rejection at 4,500 followed by a close below 4,415.8
- Stop: above 4,500
- Target: 4,300, then 4,235.9
Invalidation
- Chop between 4,300 and 4,500 is digestion after a fast move, not a failed breakout
- A close below 4,235.9 means the reclaim has failed and the old range is back in play
- Be wary of heavy positioning either way ahead of this week’s inflation prints
Summary
Our August 4 setup delivered and the target has been hit. Gold now sits between a fresh high at 4,495 and the 4,600–4,616 cluster that has rejected every attempt since June — that zone is the whole story. A clean break marks the first genuine trend change since the January top; a rejection sets up a pullback toward 4,300.
Trading futures involves substantial risk of loss and is not suitable for all investors. Past performance is not indicative of future results. This analysis is for informational and educational purposes only and does not constitute financial advice. Always conduct your own due diligence and consult with a licensed financial advisor before making any trading decisions.