- ES has rallied 10% since the bullish break of the neckline back in May.
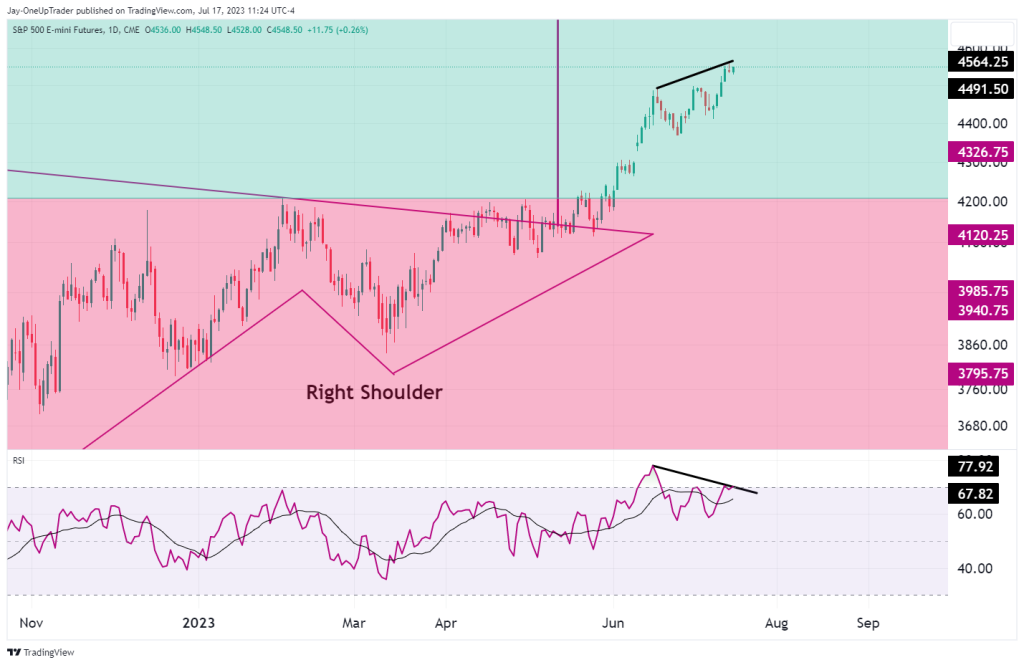
- Bearish divergence appears on the daily chart showing a decrease in buying pressure.
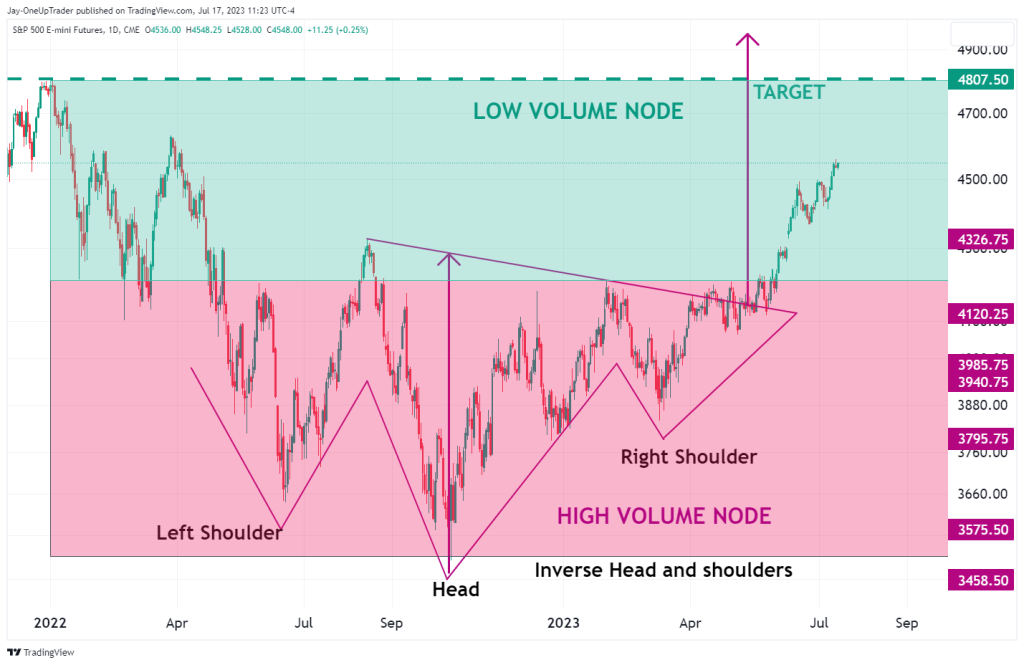
- Price remains within a low-volume node.
Recap
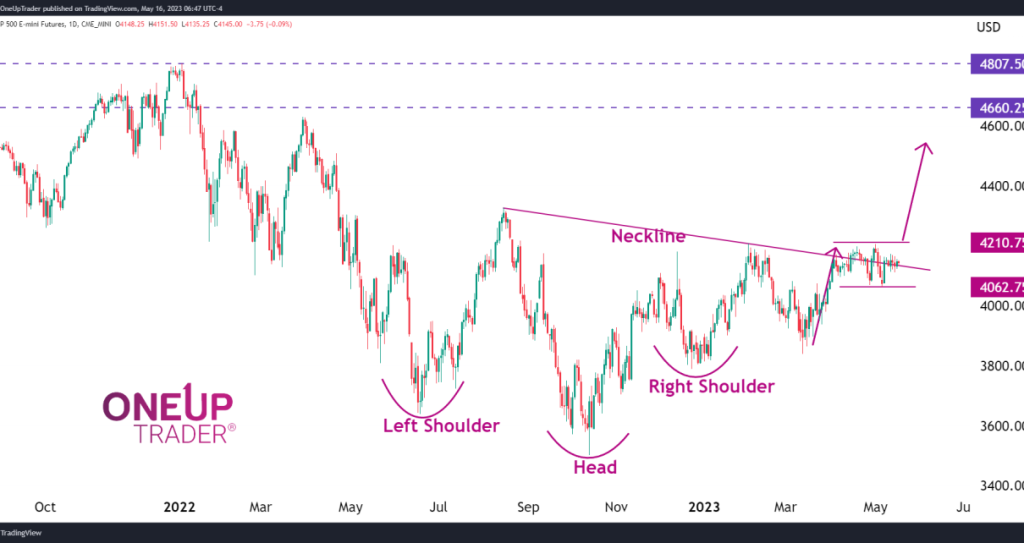
It has been two months since we did the analysis on ES breaking out of the neckline. Since then, ES has rallied 10%, and that trade has been in profit ever since. Let’s take a look at where we see ES going in the near future, but before we do, take a look at the full article here.
Pre-breakout chart
Post-breakout chart
Moving forward
There are some signs of bearish divergence on the daily chart. This can be expected since the rally has been so intense for over two months. We know that bearish divergence tells us that there is a weakness in buying pressure, so it would be prudent to wait for retracements instead of chasing the market higher. The target of $4,807.50 is still on the table for the bulls.
ES continues to trade within the low-volume node, as shown by the green rectangle on the chart below, meaning we could see continued volatility and bigger candles.