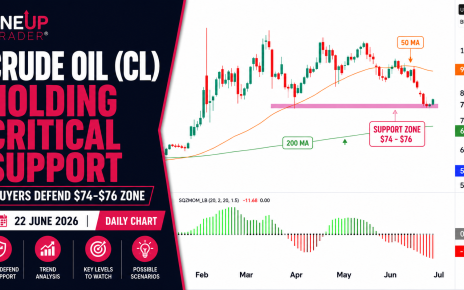
- CL trades within a significant support zone
- Last weeks close formed a bullish hammer formation
- Trade ideas for bulls
Introduction
Crude Oil has fallen from a high of $130 back in the middle of 2022 to a price of $72. Was that the highest price we will ever see in Crude Oil? The market sentiment is bearish at the moment for black gold but what do the charts say?
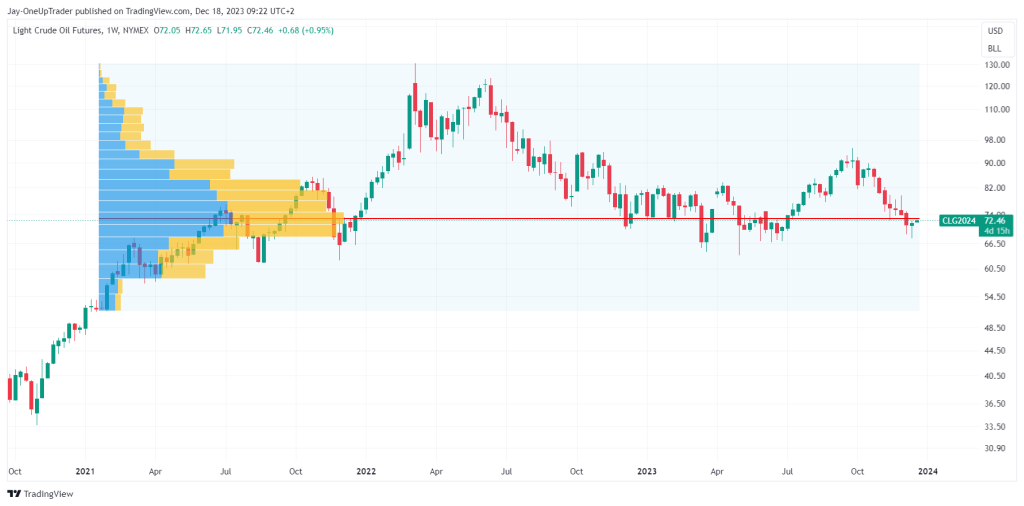
Weekly Chart
The weekly chart with a volume profile applied has its point of control line at $73 per barrel. Price is currently sitting on this level as we speak, which may spark a relief rally, especially after 7 straight weeks of declines. Last week’s close was a bullish hammer pattern which is usually very strong after such a deep decline.
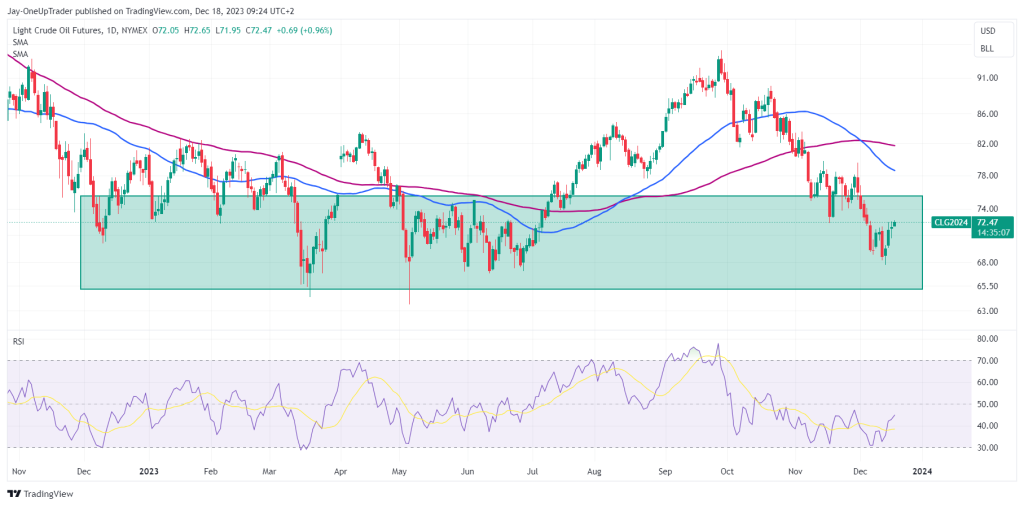
Daily Chart
The daily charts’ 50 moving average has crossed below the 100, and the RSI has been flirting with oversold for a few weeks now. There is a major support zone between $65 and $75 where we should see a lot of buying. We will most likely need a black swan event to send prices falling below this support level.
Trade Ideas
Bulls who want to go long here can place stops below the recent weekly close of $67.80. Long term traders and investors could accumulate at these levels setting stops below $65.