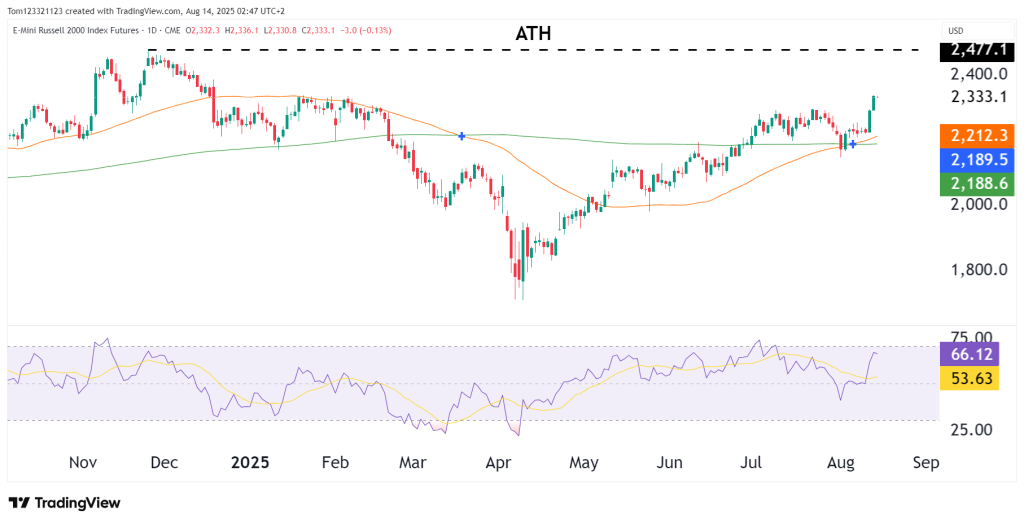
The Russell 2000 futures have surged in the past two trading sessions, up 5% marking its best two days since the 5th of November 2025. This was on the back of a positive CPI report that showed inflation is in line with expectations. The price broke decisively above the 50-day and 200-day moving averages after a prolonged sideways range. This is a very bullish sign for the index.
The breakout rally over the past week has been sharp, leaving price extended in the short term.
The next major resistance lies at the all-time high zone around 2,477, meaning there’s still room to the upside before a key decision point.
The Russell’s relative strength vs. other U.S. indices means that there is small-cap participation in the broader rally.
Momentum & Indicators
RSI at 66.12 is nearing overbought but not yet flashing an extreme warning.
The rally has been fast, so a minor pullback toward 2,300 would be healthy before another leg higher.
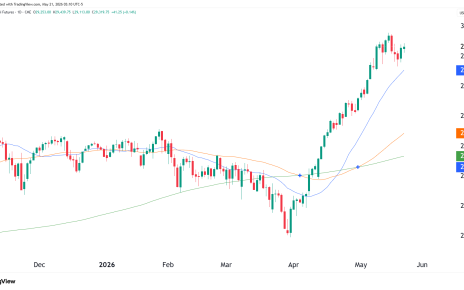
Introduction Nasdaq 100 futures continue to hold up well after their strong spring rally, even as the index takes a breather below its recent all-time highs. NQ ran from roughly 24,000 in April to a high near 31,000 by early June, and price has spent the last month digesting that move rather than reversing it. Read More…
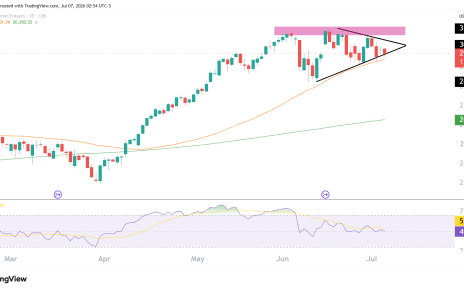
Introduction Following strength in other US equity markets, the Nasdaq 100 E-mini futures continue to show strong momentum after the aggressive recovery from the April lows. Following the sharp selloff during March and early April when the crisis in the Middle East was at its highest, buyers stepped back into the market and pushed NQ Read More…
Introduction ZB futures have been in a steady downtrend since 2020 as investors buy more and more bonds. The sentiment remains that more buying will continue meaning we can expect yields to continue to drop, and that provides us with some useful opportunities we can take advantage of. Technical analysis There is a resistance zone Read More…