

Chart Overview
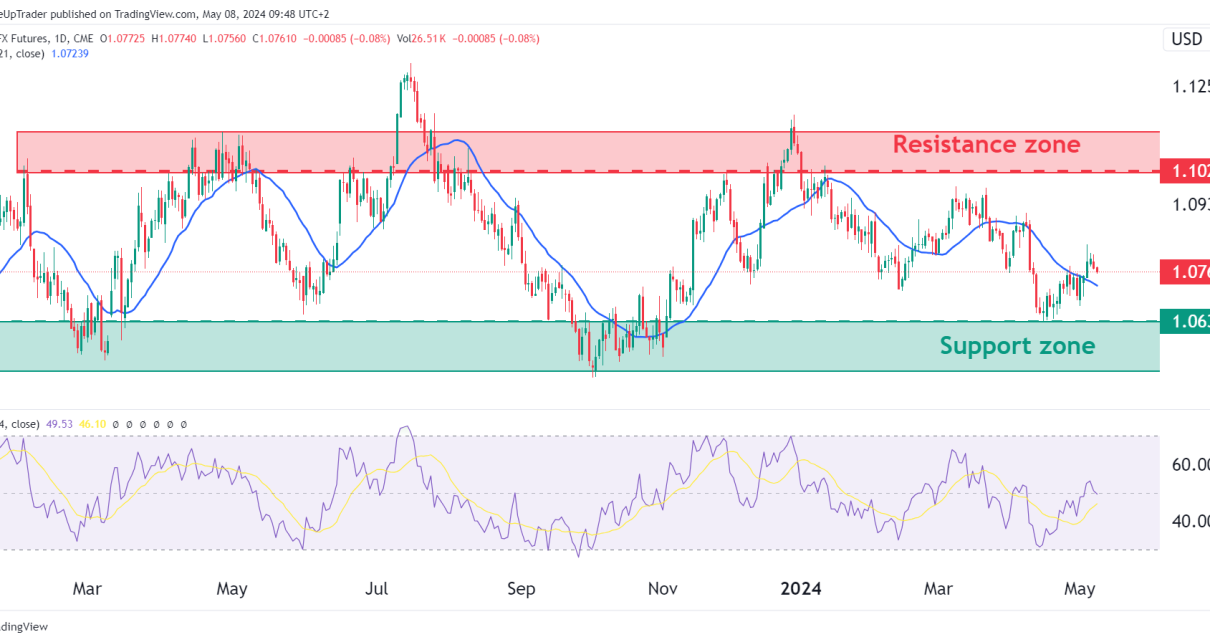
In this analysis, we’ll take a closer look at the daily chart of the Euro FX Futures, focusing on the price movements as 6E has been stuck in a range for over one year. This range is between well-defined support and resistance zones, with the resistance zone at 1.10265, and the support zone at 1.06305.

Candlesticks & Price Action
Recent candlesticks and price action indicate slight bearish bias as the price has dropped back towards the lower end of the support zone. Even the small rally we have seen since end of March shows sellers are stepping back in now.
Technical Indicators
21-day Simple Moving Average
The SMA, shown as a blue line on the chart, is currently trending downwards. This SMA is below the price right now, which would typically be seen as bullish. However, in this case, we need to see if the price can come back and test the SMA and bounce. If that happens, we could start shifting to a short-term bullish bias.
Relative Strength Index (RSI)
The RSI is near the neutral 50 mark, indicating neither strong bullish nor bearish momentum currently. This aligns with the observed range-bound market behavior. We should monitor the RSI for any significant moves toward the overbought (above 70) or oversold (below 30) levels, which could signal a reversal as long as the price remains within the price range.
Support and Resistance Levels
Support Zone
The support zone, located between 1.06305 and 1.07590, has been tested multiple times and has so far held up, indicating a strong area where buyers tend to re-enter the market. If the price manages to bounce off this zone with strong volume, it could present a potential long opportunity.
Resistance Zone
The resistance zone is clearly an area where we could consider taking shorts if the price approaches this zone and fails to break through.
Sentiment and Price Trend Forecast
Short-term Outlook (Days to Weeks)
The short-term outlook appears bearish to neutral, as the price is currently near the lower support zone, and the SMA indicates a downtrend. Traders should watch for either a bounce off the support zone or a breakdown below it for further direction.
Medium-term Outlook (Weeks to Months)
Given the established range-bound behavior, the medium-term outlook remains neutral. The key will be a breakout or breakdown from the current zones to set a new directional trend. We also need to take note of the fundamental picture because that is likely what will drive the market out of this zone.
Trade Opportunities
Bull Case
Should the price show signs of a strong bounce off the support zone with increasing volume, traders could look for potential re-entry for a move towards the upper resistance zone. However, it’s essential to set appropriate stop-loss levels and manage risk effectively.
Bear Case
A break below the support zone could indicate a shift to a bearish shift. A tough ask at the moment.
